BB&T 2015 Annual Report Download - page 67
Download and view the complete annual report
Please find page 67 of the 2015 BB&T annual report below. You can navigate through the pages in the report by either clicking on the pages listed below, or by using the keyword search tool below to find specific information within the annual report.-
 1
1 -
2
-
3
-
4
-
5
-
6
-
7
-
8
-
9
-
10
-
11
-
12
-
13
-
14
-
15
-
16
-
17
-
18
-
19
-
20
-
21
-
22
-
23
-
24
-
25
-
26
-
27
-
28
-
29
-
30
-
31
-
32
-
33
-
34
-
35
-
36
-
37
-
38
-
39
-
40
-
41
-
42
-
43
-
44
-
45
-
46
-
47
-
48
-
49
-
50
-
51
-
52
-
53
-
54
-
55
-
56
-
 57
57 -
 58
58 -
 59
59 -
 60
60 -
 61
61 -
 62
62 -
 63
63 -
 64
64 -
 65
65 -
 66
66 -
 67
67 -
 68
68 -
 69
69 -
 70
70 -
 71
71 -
 72
72 -
 73
73 -
 74
74 -
 75
75 -
 76
76 -
 77
77 -
78
-
79
-
80
-
81
-
82
-
83
-
84
-
85
-
86
-
87
-
88
-
89
-
90
-
91
-
92
-
93
-
94
-
95
-
96
-
97
-
98
-
99
-
100
-
101
-
102
-
103
-
104
-
105
-
106
-
107
-
108
-
109
-
110
-
111
-
112
-
113
-
114
-
115
-
116
-
117
-
118
-
119
-
120
-
121
-
122
-
123
-
124
-
125
-
126
-
127
-
128
-
129
-
130
-
131
-
132
-
133
-
134
-
135
-
136
-
137
-
138
-
139
-
140
-
141
-
142
-
143
-
144
-
145
-
146
-
147
-
148
-
149
-
150
-
151
-
152
-
153
-
154
-
155
-
156
-
157
-
158
-
159
-
160
-
161
-
162
-
163
-
164
-
165
-
166
-
167
-
168
-
169
-
170
-
171
-
172
-
173
-
174
-
175
-
176
-
177
-
178
-
179
-
180
-
181
-
182
-
183
-
184
-
185
-
186
-
187
-
188
-
189
-
190
-
191
-
192
-
193
-
194
-
195
-
196
-
197
-
198
-
199
-
200
-
201
-
202
-
203
-
204
-
205
-
206
-
207
-
208
-
209
-
210
-
211
-
212
-
213
-
214
-
215
-
216
-
217
-
218
-
219
-
220
-
221
-
222
-
223
-
224
-
225
-
226
-
227
-
228
-
229
-
230
-
231
-
232
-
233
-
234
-
235
-
236
-
237
-
238
-
239
-
240
-
241
-
242
-
243
-
244
-
245
-
246
-
247
-
248
-
249
-
250
-
251
-
252
-
253
-
254
-
255
-
256
-
257
-
258
-
259
-
260
-
261
-
262
-
263
-
264
-
265
-
266
-
267
-
268
-
269
-
270
-
271
-
272
-
273
-
274
-
275
-
276
-
277
-
278
-
279
-
280
-
281
-
282
-
283
-
284
-
285
-
286
-
287
-
288
-
289
-
290
-
291
-
292
-
293
-
294
-
295
-
296
-
297
-
298
-
299
-
300
-
301
-
302
-
303
-
304
-
305
-
306
-
307
-
308
-
309
-
310
-
311
-
312
-
313
-
314
-
315
-
316
-
317
-
318
-
319
-
320
-
321
-
322
-
323
-
324
-
325
-
326
-
327
-
328
-
329
-
330
-
331
-
332
-
333
-
334
-
335
-
336
-
337
-
338
-
339
-
340
-
341
-
342
-
343
-
344
-
345
-
346
-
347
-
348
-
349
-
350
-
351
-
352
-
353
-
354
-
355
-
356
-
357
-
358
-
359
-
360
-
361
-
362
-
363
-
364
-
365
-
366
-
367
-
368
-
369
-
370
 |
 |

TableofContents
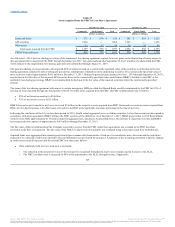
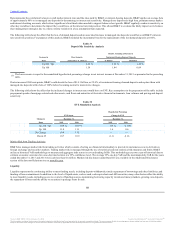
The cost of interest-bearing deposits was 0.24% for the fourth quarter, flat compared to the prior quarter.
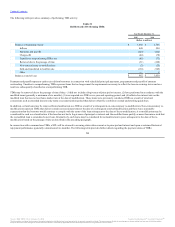
The following table provides information regarding the scheduled maturities of time deposits that are $100,000 and greater at December 31, 2015.
Three months or less $ 2,682
Over three through six months 1,170
Over six through twelve months 1,734
Over twelve months 1,976
Total $ 7,562
Short-term Borrowings
BB&T also uses various types of short-term borrowings to meet funding needs. While deposits remain the primary source for funding loan originations,
management uses short-term borrowings as a supplementary funding source for loan growth and other balance sheet management purposes. Short-term
borrowings were 1.6% of total funding on average in 2015 as compared to 1.8% in 2014. The types of short-term borrowings that have been, or may be, used
by the Company include Federal funds purchased, securities sold under repurchase agreements, master notes, commercial paper, short-term bank notes and
short-term FHLB advances. Short-term borrowings at the end of 2015 were $3.6 billion, a decrease of $124 million, or 3.3%, compared to year-end 2014.
Average short-term borrowings totaled $3.2 billion during 2015 compared to $3.4 billion last year. The decrease in the average balance of short-term
borrowings during 2015 primarily reflects an increase in deposits as a funding source.
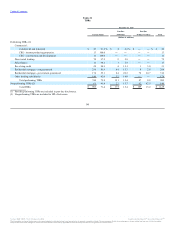
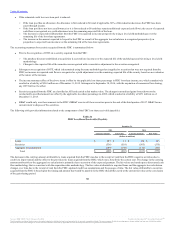
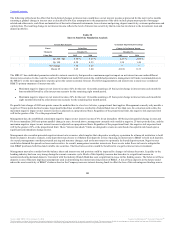
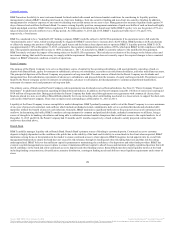
The following table summarizes certain information for the past three years with respect to short-term borrowings:
Securities Sold Under Agreements to Repurchase:
Maximum outstanding at any month-end during the year $ 1,327 $ 1,073 $ 1,537
Balance outstanding at end of year 617 317 463
Average outstanding during the year 901 526 662
Average interest rate during the year 0.23 % 0.20 % 0.25 %
Average interest rate at end of year 0.70 0.18 0.28
Federal Funds Purchased and Short-Term Borrowed Funds:
Maximum outstanding at any month-end during the year $ 4,041 $ 4,405 $ 4,722
Balance outstanding at end of year 2,976 3,400 3,675
Average outstanding during the year 2,320 2,895 3,797
Average interest rate during the year 0.11 % 0.12 % 0.13 %
Average interest rate at end of year 0.32 0.08 0.09
Long-term Debt
Long-term debt provides funding and, to a lesser extent, regulatory capital. During 2015, long-term debt represented 11.8% of average total funding
compared to 12.0% during 2014. At December 31, 2015, long-term debt totaled $23.8 billion, an increase of $457 million compared to year-end 2014. The
increase in long-term debt reflects the issuance of $1.0 billion of BB&T Corporation senior notes and $1.2 billion of Branch Bank subordinated notes, as well
as debt assumed through acquisitions, partially offset by the early extinguishment of $931 million of higher-cost FHLB debt and other payments and
maturities. The average cost of long-term debt was 2.13% in 2015, compared to 2.36% in 2014. See Note 9 “Long-Term Debt” in the “Notes to Consolidated
Financial Statements” herein for further disclosure.
60
Source: BB&T CORP, 10-K, February 25, 2016 Powered by Morningstar® Document Research℠
The information contained herein may not be copied, adapted or distributed and is not warranted to be accurate, complete or timely. The user assumes all risks for any damages or losses arising from any use of this information,
except to the extent such damages or losses cannot be limited or excluded by applicable law. Past financial performance is no guarantee of future results.