BB&T 2015 Annual Report Download - page 91
Download and view the complete annual report
Please find page 91 of the 2015 BB&T annual report below. You can navigate through the pages in the report by either clicking on the pages listed below, or by using the keyword search tool below to find specific information within the annual report.-
 1
1 -
2
-
3
-
4
-
5
-
6
-
7
-
8
-
9
-
10
-
11
-
12
-
13
-
14
-
15
-
16
-
17
-
18
-
19
-
20
-
21
-
22
-
23
-
24
-
25
-
26
-
27
-
28
-
29
-
30
-
31
-
32
-
33
-
34
-
35
-
36
-
37
-
38
-
39
-
40
-
41
-
42
-
43
-
44
-
45
-
46
-
47
-
48
-
49
-
50
-
51
-
52
-
53
-
54
-
55
-
56
-
57
-
58
-
59
-
60
-
61
-
62
-
63
-
64
-
65
-
66
-
67
-
68
-
69
-
70
-
71
-
72
-
73
-
74
-
75
-
76
-
77
-
78
-
79
-
80
-
 81
81 -
 82
82 -
 83
83 -
 84
84 -
 85
85 -
 86
86 -
 87
87 -
 88
88 -
 89
89 -
 90
90 -
 91
91 -
 92
92 -
 93
93 -
 94
94 -
 95
95 -
 96
96 -
 97
97 -
 98
98 -
 99
99 -
 100
100 -
 101
101 -
102
-
103
-
104
-
105
-
106
-
107
-
108
-
109
-
110
-
111
-
112
-
113
-
114
-
115
-
116
-
117
-
118
-
119
-
120
-
121
-
122
-
123
-
124
-
125
-
126
-
127
-
128
-
129
-
130
-
131
-
132
-
133
-
134
-
135
-
136
-
137
-
138
-
139
-
140
-
141
-
142
-
143
-
144
-
145
-
146
-
147
-
148
-
149
-
150
-
151
-
152
-
153
-
154
-
155
-
156
-
157
-
158
-
159
-
160
-
161
-
162
-
163
-
164
-
165
-
166
-
167
-
168
-
169
-
170
-
171
-
172
-
173
-
174
-
175
-
176
-
177
-
178
-
179
-
180
-
181
-
182
-
183
-
184
-
185
-
186
-
187
-
188
-
189
-
190
-
191
-
192
-
193
-
194
-
195
-
196
-
197
-
198
-
199
-
200
-
201
-
202
-
203
-
204
-
205
-
206
-
207
-
208
-
209
-
210
-
211
-
212
-
213
-
214
-
215
-
216
-
217
-
218
-
219
-
220
-
221
-
222
-
223
-
224
-
225
-
226
-
227
-
228
-
229
-
230
-
231
-
232
-
233
-
234
-
235
-
236
-
237
-
238
-
239
-
240
-
241
-
242
-
243
-
244
-
245
-
246
-
247
-
248
-
249
-
250
-
251
-
252
-
253
-
254
-
255
-
256
-
257
-
258
-
259
-
260
-
261
-
262
-
263
-
264
-
265
-
266
-
267
-
268
-
269
-
270
-
271
-
272
-
273
-
274
-
275
-
276
-
277
-
278
-
279
-
280
-
281
-
282
-
283
-
284
-
285
-
286
-
287
-
288
-
289
-
290
-
291
-
292
-
293
-
294
-
295
-
296
-
297
-
298
-
299
-
300
-
301
-
302
-
303
-
304
-
305
-
306
-
307
-
308
-
309
-
310
-
311
-
312
-
313
-
314
-
315
-
316
-
317
-
318
-
319
-
320
-
321
-
322
-
323
-
324
-
325
-
326
-
327
-
328
-
329
-
330
-
331
-
332
-
333
-
334
-
335
-
336
-
337
-
338
-
339
-
340
-
341
-
342
-
343
-
344
-
345
-
346
-
347
-
348
-
349
-
350
-
351
-
352
-
353
-
354
-
355
-
356
-
357
-
358
-
359
-
360
-
361
-
362
-
363
-
364
-
365
-
366
-
367
-
368
-
369
-
370
 |
 |

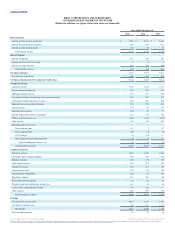
TableofContents
Interest and fees on loans and leases $ 5,347 $ 5,163 $ 5,603
Interest and dividends on securities 941 939 871
Interest on other earning assets 39 40 33
Total interest income 6,327 6,142 6,507
Interest on deposits 233 239 301
Interest on short-term borrowings 4 4 6
Interest on long-term debt 498 525 584
Total interest expense 735 768 891
5,592 5,374 5,616
Provision for credit losses 428 251 592
5,164 5,123 5,024
Insurance income 1,596 1,643 1,517
Service charges on deposits 631 632 619
Mortgage banking income 455 395 565
Investment banking and brokerage fees and commissions 398 387 383
Trust and investment advisory revenues 240 221 200
Bankcard fees and merchant discounts 218 207 202
Checkcard fees 174 163 157
Operating lease income 124 95 77
Income from bank-owned life insurance 113 110 113
FDIC loss share income, net (253) (343) (293)
Other income 326 349 445
Securities gains (losses), net
Gross realized gains 41 7 57
Gross realized losses (40) (4) (6)
OTTI charges (2) (23) ―
Non-credit portion recognized in OCI (2) 17 ―
Total securities gains (losses), net (3) (3) 51
Total noninterest income 4,019 3,856 4,036
Personnel expense 3,469 3,180 3,293
Occupancy and equipment expense 708 682 692
Software expense 192 174 158
Loan-related expense 150 267 188
Outside IT services 135 115 89
Professional services 130 139 189
Amortization of intangibles 105 91 106
Regulatory charges 101 106 143
Foreclosed property expense 53 40 55
Merger-related and restructuring charges, net 165 46 46
Loss on early extinguishment of debt 172 122 ―
Other expense 886 890 818
Total noninterest expense 6,266 5,852 5,777
Income before income taxes 2,917 3,127 3,283
Provision for income taxes 794 921 1,553
2,123 2,206 1,730
Noncontrolling interests 39 75 50
Source: BB&T CORP, 10-K, February 25, 2016 Powered by Morningstar® Document Research℠
The information contained herein may not be copied, adapted or distributed and is not warranted to be accurate, complete or timely. The user assumes all risks for any damages or losses arising from any use of this information,
except to the extent such damages or losses cannot be limited or excluded by applicable law. Past financial performance is no guarantee of future results.