BB&T 2015 Annual Report Download - page 36
Download and view the complete annual report
Please find page 36 of the 2015 BB&T annual report below. You can navigate through the pages in the report by either clicking on the pages listed below, or by using the keyword search tool below to find specific information within the annual report.-
 1
1 -
2
-
3
-
4
-
5
-
6
-
7
-
8
-
9
-
10
-
11
-
12
-
13
-
14
-
15
-
16
-
17
-
18
-
19
-
20
-
21
-
22
-
23
-
24
-
25
-
 26
26 -
 27
27 -
 28
28 -
 29
29 -
 30
30 -
 31
31 -
 32
32 -
 33
33 -
 34
34 -
 35
35 -
 36
36 -
 37
37 -
 38
38 -
 39
39 -
 40
40 -
 41
41 -
 42
42 -
 43
43 -
 44
44 -
 45
45 -
 46
46 -
47
-
48
-
49
-
50
-
51
-
52
-
53
-
54
-
55
-
56
-
57
-
58
-
59
-
60
-
61
-
62
-
63
-
64
-
65
-
66
-
67
-
68
-
69
-
70
-
71
-
72
-
73
-
74
-
75
-
76
-
77
-
78
-
79
-
80
-
81
-
82
-
83
-
84
-
85
-
86
-
87
-
88
-
89
-
90
-
91
-
92
-
93
-
94
-
95
-
96
-
97
-
98
-
99
-
100
-
101
-
102
-
103
-
104
-
105
-
106
-
107
-
108
-
109
-
110
-
111
-
112
-
113
-
114
-
115
-
116
-
117
-
118
-
119
-
120
-
121
-
122
-
123
-
124
-
125
-
126
-
127
-
128
-
129
-
130
-
131
-
132
-
133
-
134
-
135
-
136
-
137
-
138
-
139
-
140
-
141
-
142
-
143
-
144
-
145
-
146
-
147
-
148
-
149
-
150
-
151
-
152
-
153
-
154
-
155
-
156
-
157
-
158
-
159
-
160
-
161
-
162
-
163
-
164
-
165
-
166
-
167
-
168
-
169
-
170
-
171
-
172
-
173
-
174
-
175
-
176
-
177
-
178
-
179
-
180
-
181
-
182
-
183
-
184
-
185
-
186
-
187
-
188
-
189
-
190
-
191
-
192
-
193
-
194
-
195
-
196
-
197
-
198
-
199
-
200
-
201
-
202
-
203
-
204
-
205
-
206
-
207
-
208
-
209
-
210
-
211
-
212
-
213
-
214
-
215
-
216
-
217
-
218
-
219
-
220
-
221
-
222
-
223
-
224
-
225
-
226
-
227
-
228
-
229
-
230
-
231
-
232
-
233
-
234
-
235
-
236
-
237
-
238
-
239
-
240
-
241
-
242
-
243
-
244
-
245
-
246
-
247
-
248
-
249
-
250
-
251
-
252
-
253
-
254
-
255
-
256
-
257
-
258
-
259
-
260
-
261
-
262
-
263
-
264
-
265
-
266
-
267
-
268
-
269
-
270
-
271
-
272
-
273
-
274
-
275
-
276
-
277
-
278
-
279
-
280
-
281
-
282
-
283
-
284
-
285
-
286
-
287
-
288
-
289
-
290
-
291
-
292
-
293
-
294
-
295
-
296
-
297
-
298
-
299
-
300
-
301
-
302
-
303
-
304
-
305
-
306
-
307
-
308
-
309
-
310
-
311
-
312
-
313
-
314
-
315
-
316
-
317
-
318
-
319
-
320
-
321
-
322
-
323
-
324
-
325
-
326
-
327
-
328
-
329
-
330
-
331
-
332
-
333
-
334
-
335
-
336
-
337
-
338
-
339
-
340
-
341
-
342
-
343
-
344
-
345
-
346
-
347
-
348
-
349
-
350
-
351
-
352
-
353
-
354
-
355
-
356
-
357
-
358
-
359
-
360
-
361
-
362
-
363
-
364
-
365
-
366
-
367
-
368
-
369
-
370
 |
 |

TableofContents
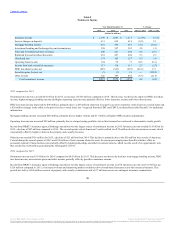
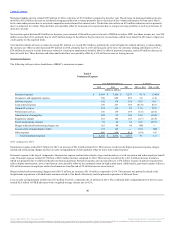
BB&T’s total assets at December 31, 2015 were $209.9 billion, an increase of $23.1 billion compared to December 31, 2014. This includes a $15.7 billion
increase in loans and leases due to acquisitions and organic growth. Commercial and industrial loans were up $7.0 billion, CRE-income producing properties
loans were up $2.7 billion and direct retail lending loans were up $3.0 billion. Mortgage loans declined $557 million due to management’s continuing
decision to sell substantially all conforming mortgage loan production and the impact of certain NPL sales, partially offset by acquisition activity. AFS
securities totaled $25.3 billion at December 31, 2015, compared to $20.9 billion at December 31, 2014. HTM securities were $18.5 billion at December 31,
2015 compared to $20.2 billion in the prior year. Goodwill, CDI and other intangible assets were also higher as the result of acquisitions.
Total deposits at December 31, 2015 were $149.1 billion, an increase of $20.1 billion from the prior year. Noninterest-bearing deposits increased $6.9 billion,
interest checking increased $5.1 billion and money market and savings increased $9.9 billion. Time deposits declined $1.8 billion. The overall growth in
lower-cost deposits reflects acquisition activity and continued organic growth. The average cost of interest-bearing deposits for 2015 was 0.24%, a decline of
two basis points compared to the prior year.
Total shareholders’ equity increased $3.0 billion, or 12.2%, compared to the prior year. This increase was primarily driven by net income in excess of
dividends totaling $1.2 billion, combined with common stock issued in connection with acquisitions. BB&T’s Tier 1 risk-based capital and total risk-based
capital ratios at December 31, 2015 were 11.8% and 14.3%, respectively, compared to 12.4% and 14.9% at December 31, 2014, respectively. Common equity
tier 1 was 10.3% at December 31, 2015.
On February 24, 2016 BB&T reached an agreement to acquire CGSC North America Holdings Corporation from Cooper Gay Swett & Crawford.
Key Challenges
BB&T’s business has become more dynamic and complex in recent years. Consequently, management has annually evaluated and, as necessary, adjusted the
Company’s business strategy in the context of the current operating environment. During this process, management considers the current financial condition
and performance of the Company and its expectations for future economic activity from both a national and local market perspective. The achievement of
BB&T’s key strategic objectives and established long-term financial goals is subject to many uncertainties and challenges. In the opinion of management,
the challenges that are most relevant and likely to have a near term impact on performance are presented below:
·Intense competition within the financial services industry given the challenge in growing assets during a period of sustained low interest rates.
·New technologies and evolving consumer preferences will put pressure on market share and customer loyalty.
·Global economic and geopolitical risk, including potential financial system instability and ramifications of sovereign debt issues.
·Cost and risk associated with regulatory reform and initiatives and IT projects.
·Merger integration risk.
In addition, certain other challenges and unforeseen events could have a near term impact on BB&T’s financial condition and results of operations. See the
section titled “Forward-Looking Statements” for additional examples of such challenges.
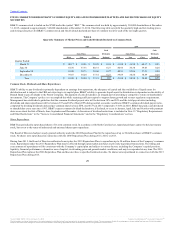
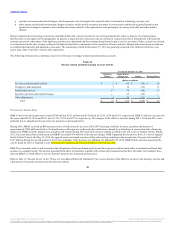
Net Interest Income and NIM
Net interest income is BB&T’s primary source of revenue. Net interest income is influenced by a number of factors, including the volume, mix and maturity
of interest-earning assets and interest-bearing liabilities and the interest rates earned and paid thereon. The difference between rates earned on interest-earning
assets and the cost of funds (with a FTE adjustment made to tax-exempt items to provide comparability with taxable items) is measured by the NIM.
31
Source: BB&T CORP, 10-K, February 25, 2016 Powered by Morningstar® Document Research℠
The information contained herein may not be copied, adapted or distributed and is not warranted to be accurate, complete or timely. The user assumes all risks for any damages or losses arising from any use of this information,
except to the extent such damages or losses cannot be limited or excluded by applicable law. Past financial performance is no guarantee of future results.