BB&T 2015 Annual Report Download - page 138
Download and view the complete annual report
Please find page 138 of the 2015 BB&T annual report below. You can navigate through the pages in the report by either clicking on the pages listed below, or by using the keyword search tool below to find specific information within the annual report.-
 1
1 -
2
-
3
-
4
-
5
-
6
-
7
-
8
-
9
-
10
-
11
-
12
-
13
-
14
-
15
-
16
-
17
-
18
-
19
-
20
-
21
-
22
-
23
-
24
-
25
-
26
-
27
-
28
-
29
-
30
-
31
-
32
-
33
-
34
-
35
-
36
-
37
-
38
-
39
-
40
-
41
-
42
-
43
-
44
-
45
-
46
-
47
-
48
-
49
-
50
-
51
-
52
-
53
-
54
-
55
-
56
-
57
-
58
-
59
-
60
-
61
-
62
-
63
-
64
-
65
-
66
-
67
-
68
-
69
-
70
-
71
-
72
-
73
-
74
-
75
-
76
-
77
-
78
-
79
-
80
-
81
-
82
-
83
-
84
-
85
-
86
-
87
-
88
-
89
-
90
-
91
-
92
-
93
-
94
-
95
-
96
-
97
-
98
-
99
-
100
-
101
-
102
-
103
-
104
-
105
-
106
-
107
-
108
-
109
-
110
-
111
-
112
-
113
-
114
-
115
-
116
-
117
-
118
-
119
-
120
-
121
-
122
-
123
-
124
-
125
-
126
-
127
-
 128
128 -
 129
129 -
 130
130 -
 131
131 -
 132
132 -
 133
133 -
 134
134 -
 135
135 -
 136
136 -
 137
137 -
 138
138 -
 139
139 -
 140
140 -
 141
141 -
 142
142 -
 143
143 -
 144
144 -
 145
145 -
 146
146 -
 147
147 -
 148
148 -
149
-
150
-
151
-
152
-
153
-
154
-
155
-
156
-
157
-
158
-
159
-
160
-
161
-
162
-
163
-
164
-
165
-
166
-
167
-
168
-
169
-
170
-
171
-
172
-
173
-
174
-
175
-
176
-
177
-
178
-
179
-
180
-
181
-
182
-
183
-
184
-
185
-
186
-
187
-
188
-
189
-
190
-
191
-
192
-
193
-
194
-
195
-
196
-
197
-
198
-
199
-
200
-
201
-
202
-
203
-
204
-
205
-
206
-
207
-
208
-
209
-
210
-
211
-
212
-
213
-
214
-
215
-
216
-
217
-
218
-
219
-
220
-
221
-
222
-
223
-
224
-
225
-
226
-
227
-
228
-
229
-
230
-
231
-
232
-
233
-
234
-
235
-
236
-
237
-
238
-
239
-
240
-
241
-
242
-
243
-
244
-
245
-
246
-
247
-
248
-
249
-
250
-
251
-
252
-
253
-
254
-
255
-
256
-
257
-
258
-
259
-
260
-
261
-
262
-
263
-
264
-
265
-
266
-
267
-
268
-
269
-
270
-
271
-
272
-
273
-
274
-
275
-
276
-
277
-
278
-
279
-
280
-
281
-
282
-
283
-
284
-
285
-
286
-
287
-
288
-
289
-
290
-
291
-
292
-
293
-
294
-
295
-
296
-
297
-
298
-
299
-
300
-
301
-
302
-
303
-
304
-
305
-
306
-
307
-
308
-
309
-
310
-
311
-
312
-
313
-
314
-
315
-
316
-
317
-
318
-
319
-
320
-
321
-
322
-
323
-
324
-
325
-
326
-
327
-
328
-
329
-
330
-
331
-
332
-
333
-
334
-
335
-
336
-
337
-
338
-
339
-
340
-
341
-
342
-
343
-
344
-
345
-
346
-
347
-
348
-
349
-
350
-
351
-
352
-
353
-
354
-
355
-
356
-
357
-
358
-
359
-
360
-
361
-
362
-
363
-
364
-
365
-
366
-
367
-
368
-
369
-
370
 |
 |

TableofContents
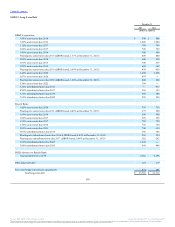
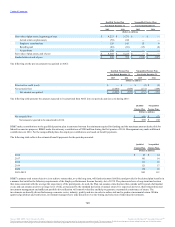
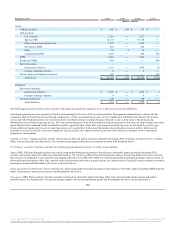
BB&T periodically reviews its asset allocation and investment policy and makes changes to its target asset allocation. BB&T has established guidelines
within each asset category to ensure the appropriate balance of risk and reward. For the year ended December 31, 2015, the target asset allocations for the
plan assets included a range of 30% to 40% for U.S. equity securities, 10% to 18% for international equity securities, 35% to 50% for fixed income securities,
and 0% to 12% for alternative investments, which include real estate, hedge funds, private equities and commodities, with any remainder to be held in cash
equivalents. The plan may hold BB&T common stock up to 10% of its assets, subject to the target range for total U.S. equity securities.
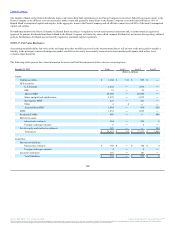
The fair value of the pension plan assets at December 31, 2015 and 2014 by asset category are reflected in the following tables.
Cash and cash-equivalents $ 266 $ 266 $ — $ — $ 66 $ 66 $ — $ —
U.S. equity securities 1,627 1,627 — — 1,635 1,635 — —
International equity securities 712 614 98 — 657 539 118 —
Fixed income securities 1,631 10 1,621 — 1,717 10 1,707 —
Alternative investments 115 — — 115 124 — — 124
Total plan assets $ 4,351 $ 2,517 $ 1,719 $ 115 $ 4,199 $ 2,250 $ 1,825 $ 124
U.S. equity securities include 3.0 million shares of BB&T common stock valued at $113 million and $117 million at December 31, 2015 and 2014,
respectively. International equity securities include a common/commingled fund that consists of assets from several accounts, pooled together, to reduce
management and administration costs. Total plan assets exclude accrued income of $18 million and $23 million at December 31, 2015 and 2014,
respectively.
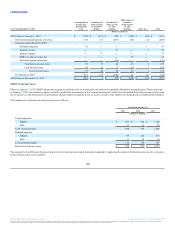
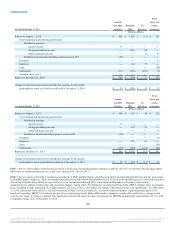
The following table presents the activity for Level 3 plan assets, all of which are in alternative investments:
Balance at beginning of year $ 124 $ 101 $ 98
Actual return on plan assets 2 11 11
Purchases, sales and settlements, net (11) 12 (8)
Balance at end of year $ 115 $ 124 $ 101
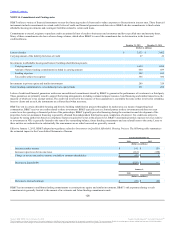
Defined Contribution Plans
BB&T offers a 401(k) Savings Plan and other defined contribution plans that permit employees to contribute from 1% to 50% of their cash compensation. For
full-time employees who are 21 years of age or older with one year or more of service, BB&T makes matching contributions of up to 6% of the employee's
compensation. BB&T's contribution to the 401(k) Savings Plan and nonqualified defined contribution plans totaled $114 million, $103 million and $102
million for the years ended December 31, 2015, 2014 and 2013, respectively. BB&T also offers defined contribution plans to certain employees of
subsidiaries who do not participate in the 401(k) Savings Plan.
Other Benefits
There are various other employment contracts, deferred compensation arrangements and covenants not to compete with selected members of management and
certain retirees. These plans and their obligations are not material to the financial statements.
125
Source: BB&T CORP, 10-K, February 25, 2016 Powered by Morningstar® Document Research℠
The information contained herein may not be copied, adapted or distributed and is not warranted to be accurate, complete or timely. The user assumes all risks for any damages or losses arising from any use of this information,
except to the extent such damages or losses cannot be limited or excluded by applicable law. Past financial performance is no guarantee of future results.