BB&T 2015 Annual Report Download - page 113
Download and view the complete annual report
Please find page 113 of the 2015 BB&T annual report below. You can navigate through the pages in the report by either clicking on the pages listed below, or by using the keyword search tool below to find specific information within the annual report.-
 1
1 -
2
-
3
-
4
-
5
-
6
-
7
-
8
-
9
-
10
-
11
-
12
-
13
-
14
-
15
-
16
-
17
-
18
-
19
-
20
-
21
-
22
-
23
-
24
-
25
-
26
-
27
-
28
-
29
-
30
-
31
-
32
-
33
-
34
-
35
-
36
-
37
-
38
-
39
-
40
-
41
-
42
-
43
-
44
-
45
-
46
-
47
-
48
-
49
-
50
-
51
-
52
-
53
-
54
-
55
-
56
-
57
-
58
-
59
-
60
-
61
-
62
-
63
-
64
-
65
-
66
-
67
-
68
-
69
-
70
-
71
-
72
-
73
-
74
-
75
-
76
-
77
-
78
-
79
-
80
-
81
-
82
-
83
-
84
-
85
-
86
-
87
-
88
-
89
-
90
-
91
-
92
-
93
-
94
-
95
-
96
-
97
-
98
-
99
-
100
-
101
-
102
-
 103
103 -
 104
104 -
 105
105 -
 106
106 -
 107
107 -
 108
108 -
 109
109 -
 110
110 -
 111
111 -
 112
112 -
 113
113 -
 114
114 -
 115
115 -
 116
116 -
 117
117 -
 118
118 -
 119
119 -
 120
120 -
 121
121 -
 122
122 -
 123
123 -
124
-
125
-
126
-
127
-
128
-
129
-
130
-
131
-
132
-
133
-
134
-
135
-
136
-
137
-
138
-
139
-
140
-
141
-
142
-
143
-
144
-
145
-
146
-
147
-
148
-
149
-
150
-
151
-
152
-
153
-
154
-
155
-
156
-
157
-
158
-
159
-
160
-
161
-
162
-
163
-
164
-
165
-
166
-
167
-
168
-
169
-
170
-
171
-
172
-
173
-
174
-
175
-
176
-
177
-
178
-
179
-
180
-
181
-
182
-
183
-
184
-
185
-
186
-
187
-
188
-
189
-
190
-
191
-
192
-
193
-
194
-
195
-
196
-
197
-
198
-
199
-
200
-
201
-
202
-
203
-
204
-
205
-
206
-
207
-
208
-
209
-
210
-
211
-
212
-
213
-
214
-
215
-
216
-
217
-
218
-
219
-
220
-
221
-
222
-
223
-
224
-
225
-
226
-
227
-
228
-
229
-
230
-
231
-
232
-
233
-
234
-
235
-
236
-
237
-
238
-
239
-
240
-
241
-
242
-
243
-
244
-
245
-
246
-
247
-
248
-
249
-
250
-
251
-
252
-
253
-
254
-
255
-
256
-
257
-
258
-
259
-
260
-
261
-
262
-
263
-
264
-
265
-
266
-
267
-
268
-
269
-
270
-
271
-
272
-
273
-
274
-
275
-
276
-
277
-
278
-
279
-
280
-
281
-
282
-
283
-
284
-
285
-
286
-
287
-
288
-
289
-
290
-
291
-
292
-
293
-
294
-
295
-
296
-
297
-
298
-
299
-
300
-
301
-
302
-
303
-
304
-
305
-
306
-
307
-
308
-
309
-
310
-
311
-
312
-
313
-
314
-
315
-
316
-
317
-
318
-
319
-
320
-
321
-
322
-
323
-
324
-
325
-
326
-
327
-
328
-
329
-
330
-
331
-
332
-
333
-
334
-
335
-
336
-
337
-
338
-
339
-
340
-
341
-
342
-
343
-
344
-
345
-
346
-
347
-
348
-
349
-
350
-
351
-
352
-
353
-
354
-
355
-
356
-
357
-
358
-
359
-
360
-
361
-
362
-
363
-
364
-
365
-
366
-
367
-
368
-
369
-
370
 |
 |

TableofContents
Certain investments in marketable debt securities and MBS issued by FNMA and FHLMC exceeded 10% of shareholders’ equity at December 31, 2015. The
FNMA investments had total amortized cost and fair value of $12.2 billion and $12.0 billion, respectively. The FHLMC investments had total amortized cost
and fair value of $5.8 billion and $5.7 billion, respectively.
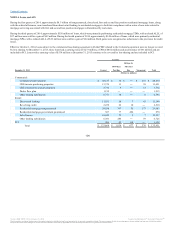
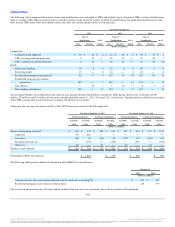
The following table reflects changes in credit losses on securities with OTTI (excluding securities acquired from the FDIC) where a portion of the unrealized
loss was recognized in OCI:
Balance at beginning of period $ 64 $ 78 $ 98
Credit losses on securities without previous OTTI ― 6 ―
Credit losses on securities for which OTTI was previously recognized 4 ― ―
Reductions for securities sold/settled during the period (22) (17) (20)
Credit recoveries through yield (4) (3) ―
Balance at end of period $ 42 $ 64 $ 78
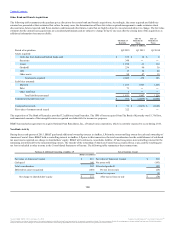
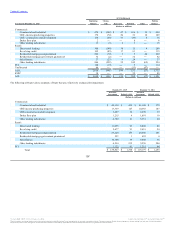
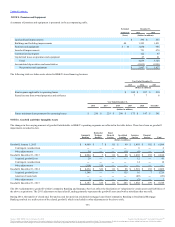
The amortized cost and estimated fair value of the securities portfolio by contractual maturity are shown in the following table. The expected life of MBS
may differ from contractual maturities because borrowers have the right to prepay the underlying mortgage loans with or without prepayment penalties.
Due in one year or less $ 265 $ 264 $ 1 $ 1
Due after one year through five years 1,661 1,667 2,097 2,101
Due after five years through ten years 971 992 4,062 3,998
Due after ten years 22,452 22,374 12,370 12,419
Total debt securities $ 25,349 $ 25,297 $ 18,530 $ 18,519
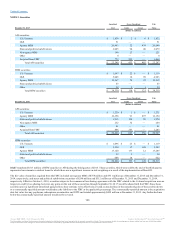
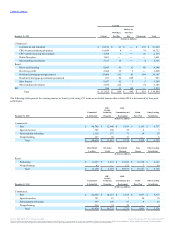
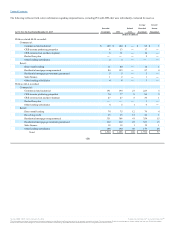
The following tables present the fair values and gross unrealized losses of investments based on the length of time that individual securities have been in a
continuous unrealized loss position:
AFS securities:
U.S. Treasury securities $ 1,211 $ 6 $ — $ — $ 1,211 $ 6
Agency MBS 12,052 199 5,576 240 17,628 439
States and political subdivisions 64 1 329 39 393 40
Total $ 13,327 $ 206 $ 5,905 $ 279 $ 19,232 $ 485
HTM securities:
GSE $ 2,307 $ 41 $ 1,743 $ 57 $ 4,050 $ 98
Agency MBS 3,992 21 124 1 4,116 22
Other securities 56 1 — — 56 1
Total $ 6,355 $ 63 $ 1,867 $ 58 $ 8,222 $ 121
102
Source: BB&T CORP, 10-K, February 25, 2016 Powered by Morningstar® Document Research℠
The information contained herein may not be copied, adapted or distributed and is not warranted to be accurate, complete or timely. The user assumes all risks for any damages or losses arising from any use of this information,
except to the extent such damages or losses cannot be limited or excluded by applicable law. Past financial performance is no guarantee of future results.