BB&T 2015 Annual Report Download - page 40
Download and view the complete annual report
Please find page 40 of the 2015 BB&T annual report below. You can navigate through the pages in the report by either clicking on the pages listed below, or by using the keyword search tool below to find specific information within the annual report.-
 1
1 -
2
-
3
-
4
-
5
-
6
-
7
-
8
-
9
-
10
-
11
-
12
-
13
-
14
-
15
-
16
-
17
-
18
-
19
-
20
-
21
-
22
-
23
-
24
-
25
-
26
-
27
-
28
-
29
-
 30
30 -
 31
31 -
 32
32 -
 33
33 -
 34
34 -
 35
35 -
 36
36 -
 37
37 -
 38
38 -
 39
39 -
 40
40 -
 41
41 -
 42
42 -
 43
43 -
 44
44 -
 45
45 -
 46
46 -
 47
47 -
 48
48 -
 49
49 -
 50
50 -
51
-
52
-
53
-
54
-
55
-
56
-
57
-
58
-
59
-
60
-
61
-
62
-
63
-
64
-
65
-
66
-
67
-
68
-
69
-
70
-
71
-
72
-
73
-
74
-
75
-
76
-
77
-
78
-
79
-
80
-
81
-
82
-
83
-
84
-
85
-
86
-
87
-
88
-
89
-
90
-
91
-
92
-
93
-
94
-
95
-
96
-
97
-
98
-
99
-
100
-
101
-
102
-
103
-
104
-
105
-
106
-
107
-
108
-
109
-
110
-
111
-
112
-
113
-
114
-
115
-
116
-
117
-
118
-
119
-
120
-
121
-
122
-
123
-
124
-
125
-
126
-
127
-
128
-
129
-
130
-
131
-
132
-
133
-
134
-
135
-
136
-
137
-
138
-
139
-
140
-
141
-
142
-
143
-
144
-
145
-
146
-
147
-
148
-
149
-
150
-
151
-
152
-
153
-
154
-
155
-
156
-
157
-
158
-
159
-
160
-
161
-
162
-
163
-
164
-
165
-
166
-
167
-
168
-
169
-
170
-
171
-
172
-
173
-
174
-
175
-
176
-
177
-
178
-
179
-
180
-
181
-
182
-
183
-
184
-
185
-
186
-
187
-
188
-
189
-
190
-
191
-
192
-
193
-
194
-
195
-
196
-
197
-
198
-
199
-
200
-
201
-
202
-
203
-
204
-
205
-
206
-
207
-
208
-
209
-
210
-
211
-
212
-
213
-
214
-
215
-
216
-
217
-
218
-
219
-
220
-
221
-
222
-
223
-
224
-
225
-
226
-
227
-
228
-
229
-
230
-
231
-
232
-
233
-
234
-
235
-
236
-
237
-
238
-
239
-
240
-
241
-
242
-
243
-
244
-
245
-
246
-
247
-
248
-
249
-
250
-
251
-
252
-
253
-
254
-
255
-
256
-
257
-
258
-
259
-
260
-
261
-
262
-
263
-
264
-
265
-
266
-
267
-
268
-
269
-
270
-
271
-
272
-
273
-
274
-
275
-
276
-
277
-
278
-
279
-
280
-
281
-
282
-
283
-
284
-
285
-
286
-
287
-
288
-
289
-
290
-
291
-
292
-
293
-
294
-
295
-
296
-
297
-
298
-
299
-
300
-
301
-
302
-
303
-
304
-
305
-
306
-
307
-
308
-
309
-
310
-
311
-
312
-
313
-
314
-
315
-
316
-
317
-
318
-
319
-
320
-
321
-
322
-
323
-
324
-
325
-
326
-
327
-
328
-
329
-
330
-
331
-
332
-
333
-
334
-
335
-
336
-
337
-
338
-
339
-
340
-
341
-
342
-
343
-
344
-
345
-
346
-
347
-
348
-
349
-
350
-
351
-
352
-
353
-
354
-
355
-
356
-
357
-
358
-
359
-
360
-
361
-
362
-
363
-
364
-
365
-
366
-
367
-
368
-
369
-
370
 |
 |

TableofContents
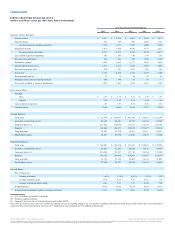
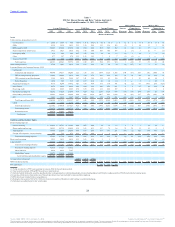
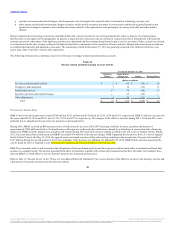
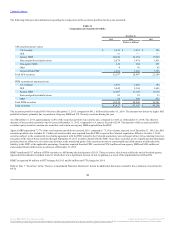
Insurance income $ 1,596 $ 1,643 $ 1,517 (2.9)% 8.3 %
Service charges on deposits 631 632 619 (0.2) 2.1
Mortgage banking income 455 395 565 15.2 (30.1)
Investment banking and brokerage fees and commissions 398 387 383 2.8 1.0
Trust and investment advisory revenues 240 221 200 8.6 10.5
Bankcard fees and merchant discounts 218 207 202 5.3 2.5
Checkcard fees 174 163 157 6.7 3.8
Operating lease income 124 95 77 30.5 23.4
Income from bank-owned life insurance 113 110 113 2.7 (2.7)
FDIC loss share income, net (253) (343) (293) (26.2) 17.1
Securities gains (losses), net (3) (3) 51 ― (105.9)
Other income 326 349 445 (6.6) (21.6)
Total noninterest income $ 4,019 $ 3,856 $ 4,036 4.2 (4.5)
2015 compared to 2014
Noninterest income was a record $4.0 billion for 2015, an increase of $163 million compared to 2014. This increase was driven by improved FDIC loss share
income, higher mortgage banking income and higher operating lease income, partially offset by lower insurance income and lower other income.
FDIC loss share income improved by $90 million, primarily due to a $58 million reduction in negative accretion related to credit losses on covered loans and
a $20 million change in the offset to the provision for covered loans. See “Acquired from the FDIC and FDIC Loss Share Receivable/Payable” for additional
information.
Mortgage banking income increased $60 million, primarily due to higher volume and $17 million of higher MSR valuation adjustments.
Operating lease income increased $29 million, primarily due to a larger leasing portfolio size as this business has continued to demonstrate steady growth.
Income from BB&T’s insurance agency/brokerage operations was the largest source of noninterest income in 2015. Insurance income totaled $1.6 billion for
2015, a decline of $47 million compared to 2014. The second quarter sale of American Coastal resulted in a $79 million decline in insurance income, which
was partially offset by higher volume in the property and casualty business.
Other income totaled $326 million for 2015, a decline of $23 million from 2014. This decline is primarily due to the $26 million loss on sale of American
Coastal during the second quarter of 2015 and $18 million of lower income related to assets for certain post-employment benefits (which is offset in
personnel expense). These declines were partially offset by higher partnerships and other investment income, which was the result of an opportunistic sale
that resulted in a $28 million gain during the third quarter of 2015.
2014 compared to 2013
Noninterest income was $3.9 billion for 2014, compared to $4.0 billion for 2013. This decrease was driven by declines in mortgage banking income, FDIC
loss share income, net securities gains and other income, partially offset by growth in insurance income.
Income from BB&T’s insurance agency/brokerage operations was the largest source of noninterest income in 2014. Insurance income was $1.6 billion, up
$126 million compared to 2013, as increased volume and improving market conditions drove broad-based increases across the insurance business. This
growth was led by a $95 million increase in property and casualty commissions and a $17 million increase in contingent insurance commissions.
35
Source: BB&T CORP, 10-K, February 25, 2016 Powered by Morningstar® Document Research℠
The information contained herein may not be copied, adapted or distributed and is not warranted to be accurate, complete or timely. The user assumes all risks for any damages or losses arising from any use of this information,
except to the extent such damages or losses cannot be limited or excluded by applicable law. Past financial performance is no guarantee of future results.