BB&T 2015 Annual Report Download - page 75
Download and view the complete annual report
Please find page 75 of the 2015 BB&T annual report below. You can navigate through the pages in the report by either clicking on the pages listed below, or by using the keyword search tool below to find specific information within the annual report.-
 1
1 -
2
-
3
-
4
-
5
-
6
-
7
-
8
-
9
-
10
-
11
-
12
-
13
-
14
-
15
-
16
-
17
-
18
-
19
-
20
-
21
-
22
-
23
-
24
-
25
-
26
-
27
-
28
-
29
-
30
-
31
-
32
-
33
-
34
-
35
-
36
-
37
-
38
-
39
-
40
-
41
-
42
-
43
-
44
-
45
-
46
-
47
-
48
-
49
-
50
-
51
-
52
-
53
-
54
-
55
-
56
-
57
-
58
-
59
-
60
-
61
-
62
-
63
-
64
-
 65
65 -
 66
66 -
 67
67 -
 68
68 -
 69
69 -
 70
70 -
 71
71 -
 72
72 -
 73
73 -
 74
74 -
 75
75 -
 76
76 -
 77
77 -
 78
78 -
 79
79 -
 80
80 -
 81
81 -
 82
82 -
 83
83 -
 84
84 -
 85
85 -
86
-
87
-
88
-
89
-
90
-
91
-
92
-
93
-
94
-
95
-
96
-
97
-
98
-
99
-
100
-
101
-
102
-
103
-
104
-
105
-
106
-
107
-
108
-
109
-
110
-
111
-
112
-
113
-
114
-
115
-
116
-
117
-
118
-
119
-
120
-
121
-
122
-
123
-
124
-
125
-
126
-
127
-
128
-
129
-
130
-
131
-
132
-
133
-
134
-
135
-
136
-
137
-
138
-
139
-
140
-
141
-
142
-
143
-
144
-
145
-
146
-
147
-
148
-
149
-
150
-
151
-
152
-
153
-
154
-
155
-
156
-
157
-
158
-
159
-
160
-
161
-
162
-
163
-
164
-
165
-
166
-
167
-
168
-
169
-
170
-
171
-
172
-
173
-
174
-
175
-
176
-
177
-
178
-
179
-
180
-
181
-
182
-
183
-
184
-
185
-
186
-
187
-
188
-
189
-
190
-
191
-
192
-
193
-
194
-
195
-
196
-
197
-
198
-
199
-
200
-
201
-
202
-
203
-
204
-
205
-
206
-
207
-
208
-
209
-
210
-
211
-
212
-
213
-
214
-
215
-
216
-
217
-
218
-
219
-
220
-
221
-
222
-
223
-
224
-
225
-
226
-
227
-
228
-
229
-
230
-
231
-
232
-
233
-
234
-
235
-
236
-
237
-
238
-
239
-
240
-
241
-
242
-
243
-
244
-
245
-
246
-
247
-
248
-
249
-
250
-
251
-
252
-
253
-
254
-
255
-
256
-
257
-
258
-
259
-
260
-
261
-
262
-
263
-
264
-
265
-
266
-
267
-
268
-
269
-
270
-
271
-
272
-
273
-
274
-
275
-
276
-
277
-
278
-
279
-
280
-
281
-
282
-
283
-
284
-
285
-
286
-
287
-
288
-
289
-
290
-
291
-
292
-
293
-
294
-
295
-
296
-
297
-
298
-
299
-
300
-
301
-
302
-
303
-
304
-
305
-
306
-
307
-
308
-
309
-
310
-
311
-
312
-
313
-
314
-
315
-
316
-
317
-
318
-
319
-
320
-
321
-
322
-
323
-
324
-
325
-
326
-
327
-
328
-
329
-
330
-
331
-
332
-
333
-
334
-
335
-
336
-
337
-
338
-
339
-
340
-
341
-
342
-
343
-
344
-
345
-
346
-
347
-
348
-
349
-
350
-
351
-
352
-
353
-
354
-
355
-
356
-
357
-
358
-
359
-
360
-
361
-
362
-
363
-
364
-
365
-
366
-
367
-
368
-
369
-
370
 |
 |

TableofContents
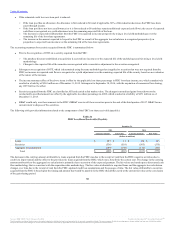
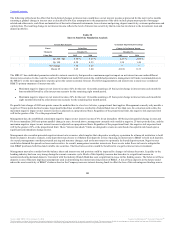
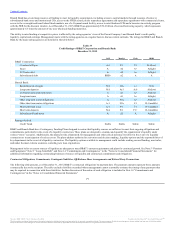
The following table shows the effect that the indicated changes in interest rates would have on net interest income as projected for the next twelve months
assuming a gradual change in interest rates as described below. Key assumptions in the preparation of the table include prepayment speeds of mortgage-
related and other assets, cash flows and maturities of derivative financial instruments, loan volumes and pricing, deposit sensitivity, customer preferences and
capital plans. The resulting change in net interest income reflects the level of interest rate sensitivity that income has in relation to the investment, loan and
deposit portfolios.
Up 200 bps 5.50 % 5.25 % 2.23 % 2.06 %
Up 100 4.50 4.25 1.58 1.46
No Change 3.50 3.25 ― ―
Down 25 3.25 3.00 (0.69) 0.33
The MRLCC has established parameters related to interest sensitivity that prescribe a maximum negative impact on net interest income under different
interest rate scenarios. In the event the results of the Simulation model fall outside the established parameters, management will make recommendations to
the MRLCC on the most appropriate response given the current economic forecast. The following parameters and interest rate scenarios are considered
BB&T’s primary measures of interest rate risk:
·Maximum negative impact on net interest income of 2% for the next 12 months assuming a 25 basis point change in interest rates each month for
four months followed by a flat interest rate scenario for the remaining eight month period.
·Maximum negative impact on net interest income of 4% for the next 12 months assuming a 25 basis point change in interest rates each month for
eight months followed by a flat interest rate scenario for the remaining four month period.
If a parallel rate change of 200 basis points cannot be modeled due to a low level of rates, a proportional limit applies. Management currently only models a
negative 25 basis point decline because larger parallel declines would have resulted in a Federal funds rate of less than zero. In a situation such as this, the
maximum negative impact on net interest income is adjusted on a proportional basis. Regardless of the proportional limit, the negative risk exposure limit
will be the greater of the 1% or the proportional limit.
Management has also established a maximum negative impact on net interest income of 4% for an immediate 100 basis points parallel change in rates and
8% for an immediate 200 basis points parallel change in rates. As noted above, management currently only models a negative 25 basis point decline, and the
maximum negative impact on net interest income is adjusted on a proportional basis. Regardless of the proportional limit, the negative risk exposure limit
will be the greater of 2% or the proportional limit. These “interest rate shock” limits are designed to create an outer band of acceptable risk based upon a
significant and immediate change in rates.
Management also considers potential negative interest rate scenarios, which implies that a depositor would pay a premium for a financial institution to hold
funds on deposit. In such a scenario, some depositors may choose to withdraw their deposits in lieu of paying an interest rate to BB&T to hold such deposits.
As a result, management considers potential pricing and structure changes, such as the movement to a primarily fee-based deposit system. Negative rates
would also diminish the spreads on loans and securities. As a result, management considers interest rate floors or rate index floors in loans to mitigate this
risk. BB&T purchases both fixed and variable rate securities. The fixed rate securities would be beneficial in a negative interest rate environment.
Management must also consider how the balance sheet and interest rate risk position could be impacted by changes in balance sheet mix. Liquidity in the
banking industry has been very strong during the current economic cycle. Much of this liquidity increase has been due to a significant increase in
noninterest-bearing demand deposits. Consistent with the industry, Branch Bank has seen a significant increase in this funding source. The behavior of these
deposits is one of the most important assumptions used in determining the interest rate risk position of BB&T. A loss of these deposits in the future would
reduce the asset sensitivity of BB&T’s balance sheet as the Company increases interest-bearing funds to offset the loss of this advantageous funding source.
68
Source: BB&T CORP, 10-K, February 25, 2016 Powered by Morningstar® Document Research℠
The information contained herein may not be copied, adapted or distributed and is not warranted to be accurate, complete or timely. The user assumes all risks for any damages or losses arising from any use of this information,
except to the extent such damages or losses cannot be limited or excluded by applicable law. Past financial performance is no guarantee of future results.