BB&T 2015 Annual Report Download - page 39
Download and view the complete annual report
Please find page 39 of the 2015 BB&T annual report below. You can navigate through the pages in the report by either clicking on the pages listed below, or by using the keyword search tool below to find specific information within the annual report.-
 1
1 -
2
-
3
-
4
-
5
-
6
-
7
-
8
-
9
-
10
-
11
-
12
-
13
-
14
-
15
-
16
-
17
-
18
-
19
-
20
-
21
-
22
-
23
-
24
-
25
-
26
-
27
-
28
-
 29
29 -
 30
30 -
 31
31 -
 32
32 -
 33
33 -
 34
34 -
 35
35 -
 36
36 -
 37
37 -
 38
38 -
 39
39 -
 40
40 -
 41
41 -
 42
42 -
 43
43 -
 44
44 -
 45
45 -
 46
46 -
 47
47 -
 48
48 -
 49
49 -
50
-
51
-
52
-
53
-
54
-
55
-
56
-
57
-
58
-
59
-
60
-
61
-
62
-
63
-
64
-
65
-
66
-
67
-
68
-
69
-
70
-
71
-
72
-
73
-
74
-
75
-
76
-
77
-
78
-
79
-
80
-
81
-
82
-
83
-
84
-
85
-
86
-
87
-
88
-
89
-
90
-
91
-
92
-
93
-
94
-
95
-
96
-
97
-
98
-
99
-
100
-
101
-
102
-
103
-
104
-
105
-
106
-
107
-
108
-
109
-
110
-
111
-
112
-
113
-
114
-
115
-
116
-
117
-
118
-
119
-
120
-
121
-
122
-
123
-
124
-
125
-
126
-
127
-
128
-
129
-
130
-
131
-
132
-
133
-
134
-
135
-
136
-
137
-
138
-
139
-
140
-
141
-
142
-
143
-
144
-
145
-
146
-
147
-
148
-
149
-
150
-
151
-
152
-
153
-
154
-
155
-
156
-
157
-
158
-
159
-
160
-
161
-
162
-
163
-
164
-
165
-
166
-
167
-
168
-
169
-
170
-
171
-
172
-
173
-
174
-
175
-
176
-
177
-
178
-
179
-
180
-
181
-
182
-
183
-
184
-
185
-
186
-
187
-
188
-
189
-
190
-
191
-
192
-
193
-
194
-
195
-
196
-
197
-
198
-
199
-
200
-
201
-
202
-
203
-
204
-
205
-
206
-
207
-
208
-
209
-
210
-
211
-
212
-
213
-
214
-
215
-
216
-
217
-
218
-
219
-
220
-
221
-
222
-
223
-
224
-
225
-
226
-
227
-
228
-
229
-
230
-
231
-
232
-
233
-
234
-
235
-
236
-
237
-
238
-
239
-
240
-
241
-
242
-
243
-
244
-
245
-
246
-
247
-
248
-
249
-
250
-
251
-
252
-
253
-
254
-
255
-
256
-
257
-
258
-
259
-
260
-
261
-
262
-
263
-
264
-
265
-
266
-
267
-
268
-
269
-
270
-
271
-
272
-
273
-
274
-
275
-
276
-
277
-
278
-
279
-
280
-
281
-
282
-
283
-
284
-
285
-
286
-
287
-
288
-
289
-
290
-
291
-
292
-
293
-
294
-
295
-
296
-
297
-
298
-
299
-
300
-
301
-
302
-
303
-
304
-
305
-
306
-
307
-
308
-
309
-
310
-
311
-
312
-
313
-
314
-
315
-
316
-
317
-
318
-
319
-
320
-
321
-
322
-
323
-
324
-
325
-
326
-
327
-
328
-
329
-
330
-
331
-
332
-
333
-
334
-
335
-
336
-
337
-
338
-
339
-
340
-
341
-
342
-
343
-
344
-
345
-
346
-
347
-
348
-
349
-
350
-
351
-
352
-
353
-
354
-
355
-
356
-
357
-
358
-
359
-
360
-
361
-
362
-
363
-
364
-
365
-
366
-
367
-
368
-
369
-
370
 |
 |

TableofContents
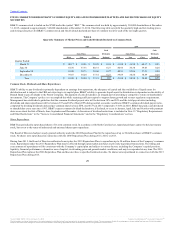
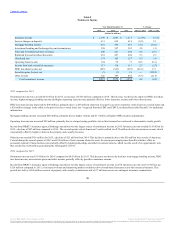
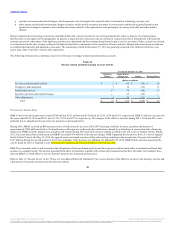
Provision for Credit Losses
2015 compared to 2014
The provision for credit losses was $428 million in 2015, an increase of $177 million compared to the prior year. The increase in the provision for credit
losses reflects allowance releases on loan sales in the prior year and stabilization in credit trends after an extended period of improvements. The ratio of the
ALLL to net charge-offs was 3.36x for 2015, compared to 2.74x for 2014. During the prior year, loan sales resulted in a combined $66 million in gains
recognized through the release of the ALLL.
Net charge-offs were 0.35% of average loans and leases held for investment for 2015, compared to 0.46% of average loans and leases held for investment
during 2014. Net charge-offs declined $102 million, or 19.0%, with improvement across several loan portfolios led by commercial and industrial loans,
which declined $45 million, and residential mortgage-nonguaranteed, which declined $38 million.
2014 compared to 2013
The provision for credit losses was $251 million in 2014, a decrease of $341 million compared to the prior year. The decrease in the provision for credit
losses reflects continued improvement in credit trends and outlook, as net charge-offs in 2014 decreased 32.1% compared to the prior year. Improving credit
conditions also resulted in an increase in the ratio of the ALLL to net charge-offs, which increased to 2.74x for 2014, compared to 2.19x for 2013.
During 2014, approximately $550 million of residential mortgage loans that were primarily performing TDRs and approximately $140 million of residential
mortgage loans that were primarily nonperforming were sold at a pre-tax gain of $42 million and $24 million, respectively. Both of these gains were
recognized as a reduction to the provision for credit losses.
Net charge-offs were 0.46% of average loans and leases held for investment for 2014, compared to 0.69% of average loans and leases held for investment
during 2013. Net charge-offs declined $254 million, or 32.1%, with improvement across most loan portfolios led by commercial and industrial loans, which
declined $112 million compared to 2013. Net charge-offs in other lending subsidiaries were $15 million higher primarily due to a process change that
resulted in the accelerated recognition of charge-offs in the nonprime automobile lending portfolio.
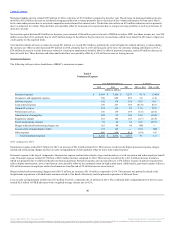
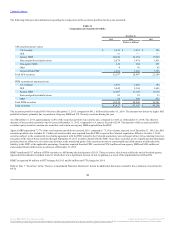
Noninterest Income
Noninterest income is a significant contributor to BB&T’s financial results. Management focuses on diversifying its sources of revenue to further reduce
BB&T’s reliance on traditional spread-based interest income, as certain fee-based activities are a relatively stable revenue source during periods of changing
interest rates.
34
Source: BB&T CORP, 10-K, February 25, 2016 Powered by Morningstar® Document Research℠
The information contained herein may not be copied, adapted or distributed and is not warranted to be accurate, complete or timely. The user assumes all risks for any damages or losses arising from any use of this information,
except to the extent such damages or losses cannot be limited or excluded by applicable law. Past financial performance is no guarantee of future results.