BB&T 2015 Annual Report Download - page 81
Download and view the complete annual report
Please find page 81 of the 2015 BB&T annual report below. You can navigate through the pages in the report by either clicking on the pages listed below, or by using the keyword search tool below to find specific information within the annual report.-
 1
1 -
2
-
3
-
4
-
5
-
6
-
7
-
8
-
9
-
10
-
11
-
12
-
13
-
14
-
15
-
16
-
17
-
18
-
19
-
20
-
21
-
22
-
23
-
24
-
25
-
26
-
27
-
28
-
29
-
30
-
31
-
32
-
33
-
34
-
35
-
36
-
37
-
38
-
39
-
40
-
41
-
42
-
43
-
44
-
45
-
46
-
47
-
48
-
49
-
50
-
51
-
52
-
53
-
54
-
55
-
56
-
57
-
58
-
59
-
60
-
61
-
62
-
63
-
64
-
65
-
66
-
67
-
68
-
69
-
70
-
 71
71 -
 72
72 -
 73
73 -
 74
74 -
 75
75 -
 76
76 -
 77
77 -
 78
78 -
 79
79 -
 80
80 -
 81
81 -
 82
82 -
 83
83 -
 84
84 -
 85
85 -
 86
86 -
 87
87 -
 88
88 -
 89
89 -
 90
90 -
 91
91 -
92
-
93
-
94
-
95
-
96
-
97
-
98
-
99
-
100
-
101
-
102
-
103
-
104
-
105
-
106
-
107
-
108
-
109
-
110
-
111
-
112
-
113
-
114
-
115
-
116
-
117
-
118
-
119
-
120
-
121
-
122
-
123
-
124
-
125
-
126
-
127
-
128
-
129
-
130
-
131
-
132
-
133
-
134
-
135
-
136
-
137
-
138
-
139
-
140
-
141
-
142
-
143
-
144
-
145
-
146
-
147
-
148
-
149
-
150
-
151
-
152
-
153
-
154
-
155
-
156
-
157
-
158
-
159
-
160
-
161
-
162
-
163
-
164
-
165
-
166
-
167
-
168
-
169
-
170
-
171
-
172
-
173
-
174
-
175
-
176
-
177
-
178
-
179
-
180
-
181
-
182
-
183
-
184
-
185
-
186
-
187
-
188
-
189
-
190
-
191
-
192
-
193
-
194
-
195
-
196
-
197
-
198
-
199
-
200
-
201
-
202
-
203
-
204
-
205
-
206
-
207
-
208
-
209
-
210
-
211
-
212
-
213
-
214
-
215
-
216
-
217
-
218
-
219
-
220
-
221
-
222
-
223
-
224
-
225
-
226
-
227
-
228
-
229
-
230
-
231
-
232
-
233
-
234
-
235
-
236
-
237
-
238
-
239
-
240
-
241
-
242
-
243
-
244
-
245
-
246
-
247
-
248
-
249
-
250
-
251
-
252
-
253
-
254
-
255
-
256
-
257
-
258
-
259
-
260
-
261
-
262
-
263
-
264
-
265
-
266
-
267
-
268
-
269
-
270
-
271
-
272
-
273
-
274
-
275
-
276
-
277
-
278
-
279
-
280
-
281
-
282
-
283
-
284
-
285
-
286
-
287
-
288
-
289
-
290
-
291
-
292
-
293
-
294
-
295
-
296
-
297
-
298
-
299
-
300
-
301
-
302
-
303
-
304
-
305
-
306
-
307
-
308
-
309
-
310
-
311
-
312
-
313
-
314
-
315
-
316
-
317
-
318
-
319
-
320
-
321
-
322
-
323
-
324
-
325
-
326
-
327
-
328
-
329
-
330
-
331
-
332
-
333
-
334
-
335
-
336
-
337
-
338
-
339
-
340
-
341
-
342
-
343
-
344
-
345
-
346
-
347
-
348
-
349
-
350
-
351
-
352
-
353
-
354
-
355
-
356
-
357
-
358
-
359
-
360
-
361
-
362
-
363
-
364
-
365
-
366
-
367
-
368
-
369
-
370
 |
 |

TableofContents
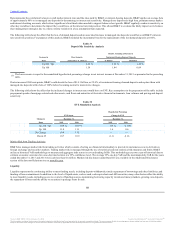
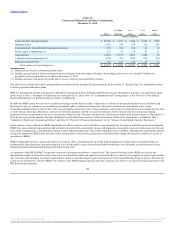
Management intends to maintain capital at Branch Bank at levels that will result in classification as “well-capitalized” for regulatory purposes. Secondarily,
it is management’s intent to maintain Branch Bank’s capital at levels that result in regulatory risk-based capital ratios that are generally comparable with
peers of similar size, complexity and risk profile. If the capital levels of Branch Bank increase above these guidelines, excess capital may be transferred to the
Parent Company in the form of special dividend payments, subject to regulatory and other operating considerations.
While nonrecurring events or management decisions may result in the Company temporarily falling below its operating minimum guidelines for one or more
of these ratios, it is management’s intent through capital planning to return to these targeted operating minimums within a reasonable period of time. Such
temporary decreases below the operating minimums shown above are not considered an infringement of BB&T’s overall capital policy, provided a return
above the minimums is forecast to occur within a reasonable time period.
BB&T regularly performs stress testing on its capital levels and is required to periodically submit the company’s capital plans to the banking regulators. The
FRB did not object to the Company’s 2015 capital plan, and the 2016 capital plan is expected to be submitted during April 2016. Management’s capital
deployment plan in order of preference is to focus on organic growth, dividends, strategic opportunities and share repurchases.
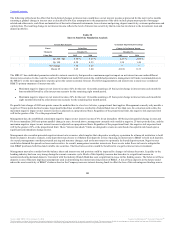
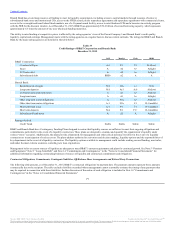
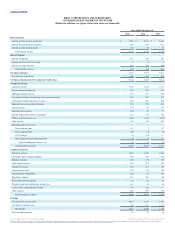
Risk-based capital ratios, which include Tier 1 Capital, Total Capital and Tier 1 Common Equity, are calculated based on regulatory guidance related to the
measurement of capital and risk-weighted assets. The decrease in regulatory capital was primarily due to current year acquisition activity, partially offset by
earnings in excess of dividends.
Risk-based:
Common equity Tier 1 10.3 % N/A
Tier 1 11.8 12.4 %
Total 14.3 14.9
Leverage capital 9.8 9.9
Non-GAAP capital measures (1):
Tangible common equity as a percentage of tangible assets 7.7 % 8.0 %
Tangible common equity per common share $ 19.82 $ 19.86
Calculations of tangible common equity and tangible assets (1):
Total shareholders' equity $ 27,340 $ 24,377
Less:
Preferred stock 2,603 2,603
Noncontrolling interests 34 88
Intangible assets 9,234 7,374
Tangible common equity $ 15,469 $ 14,312
Total assets $ 209,947 $ 186,834
Less:
Intangible assets 9,234 7,374
Tangible assets $ 200,713 $ 179,460
Risk-weighted assets (2) $ 166,611 $ 143,675
Common shares outstanding at end of period 780,337 720,698
(1) Tangible common equity and related ratios are non-GAAP measures. Management uses these measures to assess the quality of capital and believes that
investors may find them useful in their analysis of the Company. These capital measures are not necessarily comparable to similar capital measures that
may be presented by other companies.
(2) Risk-weighted assets are determined based on the regulatory capital requirements in effect for the periods presented.
The Company’s estimated common equity tier 1 ratio using the Basel III standardized approach on a fully phased-in basis was 10.0% at December 31, 2015.
74
Source: BB&T CORP, 10-K, February 25, 2016 Powered by Morningstar® Document Research℠
The information contained herein may not be copied, adapted or distributed and is not warranted to be accurate, complete or timely. The user assumes all risks for any damages or losses arising from any use of this information,
except to the extent such damages or losses cannot be limited or excluded by applicable law. Past financial performance is no guarantee of future results.