BB&T 2015 Annual Report Download - page 147
Download and view the complete annual report
Please find page 147 of the 2015 BB&T annual report below. You can navigate through the pages in the report by either clicking on the pages listed below, or by using the keyword search tool below to find specific information within the annual report.-
 1
1 -
2
-
3
-
4
-
5
-
6
-
7
-
8
-
9
-
10
-
11
-
12
-
13
-
14
-
15
-
16
-
17
-
18
-
19
-
20
-
21
-
22
-
23
-
24
-
25
-
26
-
27
-
28
-
29
-
30
-
31
-
32
-
33
-
34
-
35
-
36
-
37
-
38
-
39
-
40
-
41
-
42
-
43
-
44
-
45
-
46
-
47
-
48
-
49
-
50
-
51
-
52
-
53
-
54
-
55
-
56
-
57
-
58
-
59
-
60
-
61
-
62
-
63
-
64
-
65
-
66
-
67
-
68
-
69
-
70
-
71
-
72
-
73
-
74
-
75
-
76
-
77
-
78
-
79
-
80
-
81
-
82
-
83
-
84
-
85
-
86
-
87
-
88
-
89
-
90
-
91
-
92
-
93
-
94
-
95
-
96
-
97
-
98
-
99
-
100
-
101
-
102
-
103
-
104
-
105
-
106
-
107
-
108
-
109
-
110
-
111
-
112
-
113
-
114
-
115
-
116
-
117
-
118
-
119
-
120
-
121
-
122
-
123
-
124
-
125
-
126
-
127
-
128
-
129
-
130
-
131
-
132
-
133
-
134
-
135
-
136
-
 137
137 -
 138
138 -
 139
139 -
 140
140 -
 141
141 -
 142
142 -
 143
143 -
 144
144 -
 145
145 -
 146
146 -
 147
147 -
 148
148 -
 149
149 -
 150
150 -
 151
151 -
 152
152 -
 153
153 -
 154
154 -
 155
155 -
 156
156 -
 157
157 -
158
-
159
-
160
-
161
-
162
-
163
-
164
-
165
-
166
-
167
-
168
-
169
-
170
-
171
-
172
-
173
-
174
-
175
-
176
-
177
-
178
-
179
-
180
-
181
-
182
-
183
-
184
-
185
-
186
-
187
-
188
-
189
-
190
-
191
-
192
-
193
-
194
-
195
-
196
-
197
-
198
-
199
-
200
-
201
-
202
-
203
-
204
-
205
-
206
-
207
-
208
-
209
-
210
-
211
-
212
-
213
-
214
-
215
-
216
-
217
-
218
-
219
-
220
-
221
-
222
-
223
-
224
-
225
-
226
-
227
-
228
-
229
-
230
-
231
-
232
-
233
-
234
-
235
-
236
-
237
-
238
-
239
-
240
-
241
-
242
-
243
-
244
-
245
-
246
-
247
-
248
-
249
-
250
-
251
-
252
-
253
-
254
-
255
-
256
-
257
-
258
-
259
-
260
-
261
-
262
-
263
-
264
-
265
-
266
-
267
-
268
-
269
-
270
-
271
-
272
-
273
-
274
-
275
-
276
-
277
-
278
-
279
-
280
-
281
-
282
-
283
-
284
-
285
-
286
-
287
-
288
-
289
-
290
-
291
-
292
-
293
-
294
-
295
-
296
-
297
-
298
-
299
-
300
-
301
-
302
-
303
-
304
-
305
-
306
-
307
-
308
-
309
-
310
-
311
-
312
-
313
-
314
-
315
-
316
-
317
-
318
-
319
-
320
-
321
-
322
-
323
-
324
-
325
-
326
-
327
-
328
-
329
-
330
-
331
-
332
-
333
-
334
-
335
-
336
-
337
-
338
-
339
-
340
-
341
-
342
-
343
-
344
-
345
-
346
-
347
-
348
-
349
-
350
-
351
-
352
-
353
-
354
-
355
-
356
-
357
-
358
-
359
-
360
-
361
-
362
-
363
-
364
-
365
-
366
-
367
-
368
-
369
-
370
 |
 |

TableofContents
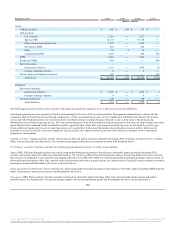
Other securities: These securities consist primarily of mutual funds and corporate bonds. These securities are valued based on a review of quoted market
prices for assets as well as through the various other inputs discussed previously.
Acquired from FDIC securities: Securities acquired from the FDIC consist of re-remic non-agency MBS, municipal securities and non-agency MBS. State and
political subdivision securities and certain non-agency MBS acquired from the FDIC are valued in a manner similar to the approach described above for
those asset classes. The re-remic non-agency MBS, which are categorized as Level 3, are valued based on broker dealer quotes that reflected certain
unobservable market inputs.
LHFS: Certain mortgage loans are originated to be sold to investors, which are carried at fair value. The fair value is primarily based on quoted market prices
for securities backed by similar types of loans. The changes in fair value of these assets are largely driven by changes in interest rates subsequent to loan
funding and changes in the fair value of servicing associated with the mortgage LHFS.
Residential MSRs: Residential MSRs are valued using an OAS valuation model to project cash flows over multiple interest rate scenarios, which are then
discounted at risk-adjusted rates. The model considers portfolio characteristics, contractually specified servicing fees, prepayment assumptions, delinquency
rates, late charges, other ancillary revenue, costs to service and other economic factors. Fair value estimates and assumptions are compared to industry
surveys, recent market activity, actual portfolio experience and, when available, other observable market data.
Derivative assets and liabilities: The fair values of derivatives are determined based on quoted market prices and internal pricing models that are primarily
sensitive to market observable data. The fair values of interest rate lock commitments, which are related to mortgage loan commitments and are categorized as
Level 3, are based on quoted market prices adjusted for commitments that are not expected to fund and include the value attributable to the net servicing
fees.
Private equity and similar investments: Private equity and similar investments are measured at fair value based on the investment’s net asset value. In many
cases there are no observable market values for these investments and therefore management must estimate the fair value based on a comparison of the
operating performance of the company to multiples in the marketplace for similar entities. This analysis requires significant judgment, and actual values in a
sale could differ materially from those estimated.
Securities sold short: Securities sold short represent debt securities sold short that are entered into as a hedging strategy for the purposes of supporting
institutional and retail client trading activities.
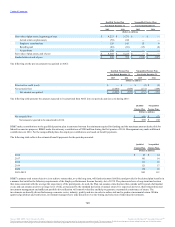
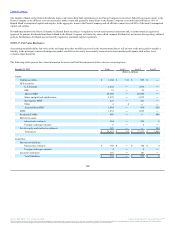
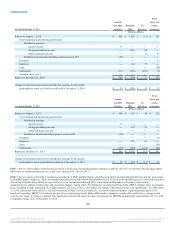
The following tables present activity for financial liabilities that are valued using Level 3 inputs:
Balance at January 1, 2015 $ 745 $ 844 $ 17 $ 329
Total realized and unrealized gains (losses):
Included in earnings:
Interest income 23 ― ― ―
Mortgage banking income ― 10 87 ―
Other noninterest income ― ― (6) 49
Included in unrealized net holding gains (losses) in OCI (45) ― ― ―
Purchases ― ― 1 81
Issuances ― 156 74 ―
Sales ― ― ― (154)
Settlements (97) (130) (169) (16)
Balance at December 31, 2015 $ 626 $ 880 $ 4 $ 289
Change in unrealized gains (losses) included in earnings for the period,
attributable to assets and liabilities still held at December 31, 2015 $ 23 $ 10 $ 4 $ (2)
134
Source: BB&T CORP, 10-K, February 25, 2016 Powered by Morningstar® Document Research℠
The information contained herein may not be copied, adapted or distributed and is not warranted to be accurate, complete or timely. The user assumes all risks for any damages or losses arising from any use of this information,
except to the extent such damages or losses cannot be limited or excluded by applicable law. Past financial performance is no guarantee of future results.