BB&T 2015 Annual Report Download - page 82
Download and view the complete annual report
Please find page 82 of the 2015 BB&T annual report below. You can navigate through the pages in the report by either clicking on the pages listed below, or by using the keyword search tool below to find specific information within the annual report.-
 1
1 -
2
-
3
-
4
-
5
-
6
-
7
-
8
-
9
-
10
-
11
-
12
-
13
-
14
-
15
-
16
-
17
-
18
-
19
-
20
-
21
-
22
-
23
-
24
-
25
-
26
-
27
-
28
-
29
-
30
-
31
-
32
-
33
-
34
-
35
-
36
-
37
-
38
-
39
-
40
-
41
-
42
-
43
-
44
-
45
-
46
-
47
-
48
-
49
-
50
-
51
-
52
-
53
-
54
-
55
-
56
-
57
-
58
-
59
-
60
-
61
-
62
-
63
-
64
-
65
-
66
-
67
-
68
-
69
-
70
-
71
-
 72
72 -
 73
73 -
 74
74 -
 75
75 -
 76
76 -
 77
77 -
 78
78 -
 79
79 -
 80
80 -
 81
81 -
 82
82 -
 83
83 -
 84
84 -
 85
85 -
 86
86 -
 87
87 -
 88
88 -
 89
89 -
 90
90 -
 91
91 -
 92
92 -
93
-
94
-
95
-
96
-
97
-
98
-
99
-
100
-
101
-
102
-
103
-
104
-
105
-
106
-
107
-
108
-
109
-
110
-
111
-
112
-
113
-
114
-
115
-
116
-
117
-
118
-
119
-
120
-
121
-
122
-
123
-
124
-
125
-
126
-
127
-
128
-
129
-
130
-
131
-
132
-
133
-
134
-
135
-
136
-
137
-
138
-
139
-
140
-
141
-
142
-
143
-
144
-
145
-
146
-
147
-
148
-
149
-
150
-
151
-
152
-
153
-
154
-
155
-
156
-
157
-
158
-
159
-
160
-
161
-
162
-
163
-
164
-
165
-
166
-
167
-
168
-
169
-
170
-
171
-
172
-
173
-
174
-
175
-
176
-
177
-
178
-
179
-
180
-
181
-
182
-
183
-
184
-
185
-
186
-
187
-
188
-
189
-
190
-
191
-
192
-
193
-
194
-
195
-
196
-
197
-
198
-
199
-
200
-
201
-
202
-
203
-
204
-
205
-
206
-
207
-
208
-
209
-
210
-
211
-
212
-
213
-
214
-
215
-
216
-
217
-
218
-
219
-
220
-
221
-
222
-
223
-
224
-
225
-
226
-
227
-
228
-
229
-
230
-
231
-
232
-
233
-
234
-
235
-
236
-
237
-
238
-
239
-
240
-
241
-
242
-
243
-
244
-
245
-
246
-
247
-
248
-
249
-
250
-
251
-
252
-
253
-
254
-
255
-
256
-
257
-
258
-
259
-
260
-
261
-
262
-
263
-
264
-
265
-
266
-
267
-
268
-
269
-
270
-
271
-
272
-
273
-
274
-
275
-
276
-
277
-
278
-
279
-
280
-
281
-
282
-
283
-
284
-
285
-
286
-
287
-
288
-
289
-
290
-
291
-
292
-
293
-
294
-
295
-
296
-
297
-
298
-
299
-
300
-
301
-
302
-
303
-
304
-
305
-
306
-
307
-
308
-
309
-
310
-
311
-
312
-
313
-
314
-
315
-
316
-
317
-
318
-
319
-
320
-
321
-
322
-
323
-
324
-
325
-
326
-
327
-
328
-
329
-
330
-
331
-
332
-
333
-
334
-
335
-
336
-
337
-
338
-
339
-
340
-
341
-
342
-
343
-
344
-
345
-
346
-
347
-
348
-
349
-
350
-
351
-
352
-
353
-
354
-
355
-
356
-
357
-
358
-
359
-
360
-
361
-
362
-
363
-
364
-
365
-
366
-
367
-
368
-
369
-
370
 |
 |

TableofContents
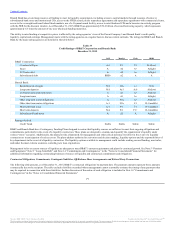
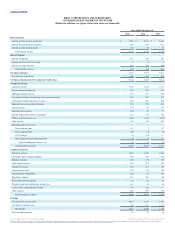
Consolidated Summary of Operations:
Interest income $ 1,695 $ 1,650 $ 1,489 $ 1,493 $ 1,518 $ 1,541 $ 1,537 $ 1,546
Interest expense 191 186 177 181 183 192 194 199
Provision for credit losses 129 103 97 99 83 34 74 60
Securities gains (losses), net ― (2) (1) ― ― (5) - 2
Other noninterest income 1,015 990 1,020 997 1,022 954 958 925
Noninterest expense 1,597 1,594 1,653 1,422 1,394 1,539 1,534 1,385
Provision for income taxes 251 222 80 241 277 172 216 256
Net income 542 533 501 547 603 553 477 573
Noncontrolling interest 3 4 10 22 15 4 16 40
Preferred stock dividends 37 37 37 37 37 37 37 37
Net income available to common
shareholders $ 502 $ 492 $ 454 $ 488 $ 551 $ 512 $ 424 $ 496
Basic EPS $ 0.64 $ 0.64 $ 0.63 $ 0.68 $ 0.77 $ 0.71 $ 0.59 $ 0.70
Diluted EPS $ 0.64 $ 0.64 $ 0.62 $ 0.67 $ 0.75 $ 0.70 $ 0.58 $ 0.68
Selected Average Balances:
Assets $ 209,217 $ 203,531 $ 189,033 $ 187,297 $ 186,462 $ 186,339 $ 185,094 $ 182,428
Securities, at amortized cost 43,468 43,048 40,727 41,133 40,817 40,566 40,656 40,117
Loans and leases (2) 136,190 132,499 122,056 120,235 119,912 120,471 118,510 116,372
Total earning assets 183,151 178,464 165,428 163,367 162,559 162,879 161,143 158,364
Deposits 148,491 143,837 131,868 129,531 130,315 130,608 129,599 125,718
Short-term borrowings 2,698 3,572 3,080 3,539 3,095 3,321 2,962 4,321
Long-term debt 24,306 23,394 22,616 23,043 22,139 22,069 22,206 22,432
Total interest-bearing liabilities 129,671 126,650 116,062 116,412 116,419 117,895 118,133 117,079
Shareholders' equity 27,378 26,612 24,888 24,566 24,574 24,151 23,841 23,233
(1) Effective January 1, 2015, BB&T adopted new guidance related to investments in qualified affordable housing projects. See Note 14 “Commitments and Contingencies” for
additional information.
(2) Loans and leases are net of unearned income and include LHFS.
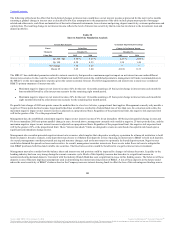
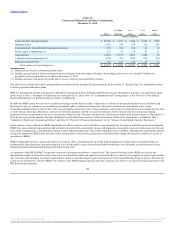
Fourth Quarter Results
Consolidated net income available to common shareholders for the fourth quarter of 2015 totaling $502 million was down 8.9% compared to $551 million
earned during the same period in 2014. On a diluted per common share basis, earnings for the fourth quarter of 2015 were $0.64, down 14.7% compared to
$0.75 for the same period in 2014. BB&T’s results of operations for the fourth quarter of 2015 produced an annualized return on average assets of 1.03% and
an annualized return on average common shareholders’ equity of 8.06%, compared to prior year ratios of 1.28% and 9.99%, respectively. These results
include merger-related and restructuring charges of $50 million and $18 million, respectively.
Total revenues on a FTE basis were $2.6 billion for the fourth quarter of 2015, up $164 million compared to the earlier quarter. This increase was driven by a
$171 million increase in taxable-equivalent net interest income, largely the result of the Susquehanna and The Bank of Kentucky acquisitions
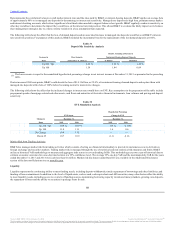
Net interest margin was 3.35%, compared to 3.36% for the earlier quarter. Average earning assets increased $20.6 billion, or 12.7%, while average interest-
bearing liabilities increased $13.3 billion, or 11.4%, both of which were primarily driven by the Susquehanna and The Bank of Kentucky acquisitions. The
annualized yield on the total loan portfolio for the fourth quarter was 4.31%, an increase of two basis points compared to the earlier quarter, which primarily
reflects the impact of the current year acquisitions, partially offset by runoff of loans acquired from the FDIC. The annualized fully taxable-equivalent yield
on the average securities portfolio for the fourth quarter was 2.30%, compared to 2.45% for the earlier period. This decline reflects lower rates on mortgage-
backed securities, runoff of securities acquired from the FDIC and larger holdings in U.S. Treasuries.
75
Source: BB&T CORP, 10-K, February 25, 2016 Powered by Morningstar® Document Research℠
The information contained herein may not be copied, adapted or distributed and is not warranted to be accurate, complete or timely. The user assumes all risks for any damages or losses arising from any use of this information,
except to the extent such damages or losses cannot be limited or excluded by applicable law. Past financial performance is no guarantee of future results.