BB&T 2015 Annual Report Download - page 63
Download and view the complete annual report
Please find page 63 of the 2015 BB&T annual report below. You can navigate through the pages in the report by either clicking on the pages listed below, or by using the keyword search tool below to find specific information within the annual report.-
 1
1 -
2
-
3
-
4
-
5
-
6
-
7
-
8
-
9
-
10
-
11
-
12
-
13
-
14
-
15
-
16
-
17
-
18
-
19
-
20
-
21
-
22
-
23
-
24
-
25
-
26
-
27
-
28
-
29
-
30
-
31
-
32
-
33
-
34
-
35
-
36
-
37
-
38
-
39
-
40
-
41
-
42
-
43
-
44
-
45
-
46
-
47
-
48
-
49
-
50
-
51
-
52
-
 53
53 -
 54
54 -
 55
55 -
 56
56 -
 57
57 -
 58
58 -
 59
59 -
 60
60 -
 61
61 -
 62
62 -
 63
63 -
 64
64 -
 65
65 -
 66
66 -
 67
67 -
 68
68 -
 69
69 -
 70
70 -
 71
71 -
 72
72 -
 73
73 -
74
-
75
-
76
-
77
-
78
-
79
-
80
-
81
-
82
-
83
-
84
-
85
-
86
-
87
-
88
-
89
-
90
-
91
-
92
-
93
-
94
-
95
-
96
-
97
-
98
-
99
-
100
-
101
-
102
-
103
-
104
-
105
-
106
-
107
-
108
-
109
-
110
-
111
-
112
-
113
-
114
-
115
-
116
-
117
-
118
-
119
-
120
-
121
-
122
-
123
-
124
-
125
-
126
-
127
-
128
-
129
-
130
-
131
-
132
-
133
-
134
-
135
-
136
-
137
-
138
-
139
-
140
-
141
-
142
-
143
-
144
-
145
-
146
-
147
-
148
-
149
-
150
-
151
-
152
-
153
-
154
-
155
-
156
-
157
-
158
-
159
-
160
-
161
-
162
-
163
-
164
-
165
-
166
-
167
-
168
-
169
-
170
-
171
-
172
-
173
-
174
-
175
-
176
-
177
-
178
-
179
-
180
-
181
-
182
-
183
-
184
-
185
-
186
-
187
-
188
-
189
-
190
-
191
-
192
-
193
-
194
-
195
-
196
-
197
-
198
-
199
-
200
-
201
-
202
-
203
-
204
-
205
-
206
-
207
-
208
-
209
-
210
-
211
-
212
-
213
-
214
-
215
-
216
-
217
-
218
-
219
-
220
-
221
-
222
-
223
-
224
-
225
-
226
-
227
-
228
-
229
-
230
-
231
-
232
-
233
-
234
-
235
-
236
-
237
-
238
-
239
-
240
-
241
-
242
-
243
-
244
-
245
-
246
-
247
-
248
-
249
-
250
-
251
-
252
-
253
-
254
-
255
-
256
-
257
-
258
-
259
-
260
-
261
-
262
-
263
-
264
-
265
-
266
-
267
-
268
-
269
-
270
-
271
-
272
-
273
-
274
-
275
-
276
-
277
-
278
-
279
-
280
-
281
-
282
-
283
-
284
-
285
-
286
-
287
-
288
-
289
-
290
-
291
-
292
-
293
-
294
-
295
-
296
-
297
-
298
-
299
-
300
-
301
-
302
-
303
-
304
-
305
-
306
-
307
-
308
-
309
-
310
-
311
-
312
-
313
-
314
-
315
-
316
-
317
-
318
-
319
-
320
-
321
-
322
-
323
-
324
-
325
-
326
-
327
-
328
-
329
-
330
-
331
-
332
-
333
-
334
-
335
-
336
-
337
-
338
-
339
-
340
-
341
-
342
-
343
-
344
-
345
-
346
-
347
-
348
-
349
-
350
-
351
-
352
-
353
-
354
-
355
-
356
-
357
-
358
-
359
-
360
-
361
-
362
-
363
-
364
-
365
-
366
-
367
-
368
-
369
-
370
 |
 |
TableofContents
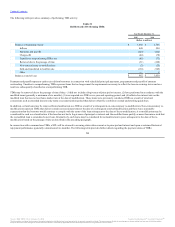
The ALLL amounted to 1.07% of loans and leases held for investment at December 31, 2015, compared to 1.23% at December 31, 2014. This decline is
primarily due to the acquisitions occurring during 2015, which provided $14.2 billion in loans and no related allowance as of the various acquisition dates.
The ratio of the ALLL to NPLs held for investment was 2.53x at December 31, 2015 compared to 2.39x at December 31, 2014.
Net charge-offs totaled $436 million for 2015, compared to $538 million in 2014. Net charge-offs as a percentage of average loans and leases were 0.35% for
2015, compared to 0.46% in 2014. Net charge-offs declined in most loan portfolios, including decreases in the commercial and industrial and residential
mortgage-nonguaranteed portfolios of 50.6% and 50.7%, respectively. CRE – construction and development had net recoveries of $7 million for the year.
Refer to Note 4 “Loans and ACL” in the “Notes to Consolidated Financial Statements” for additional disclosures.
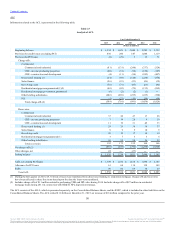
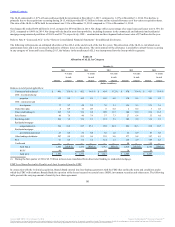
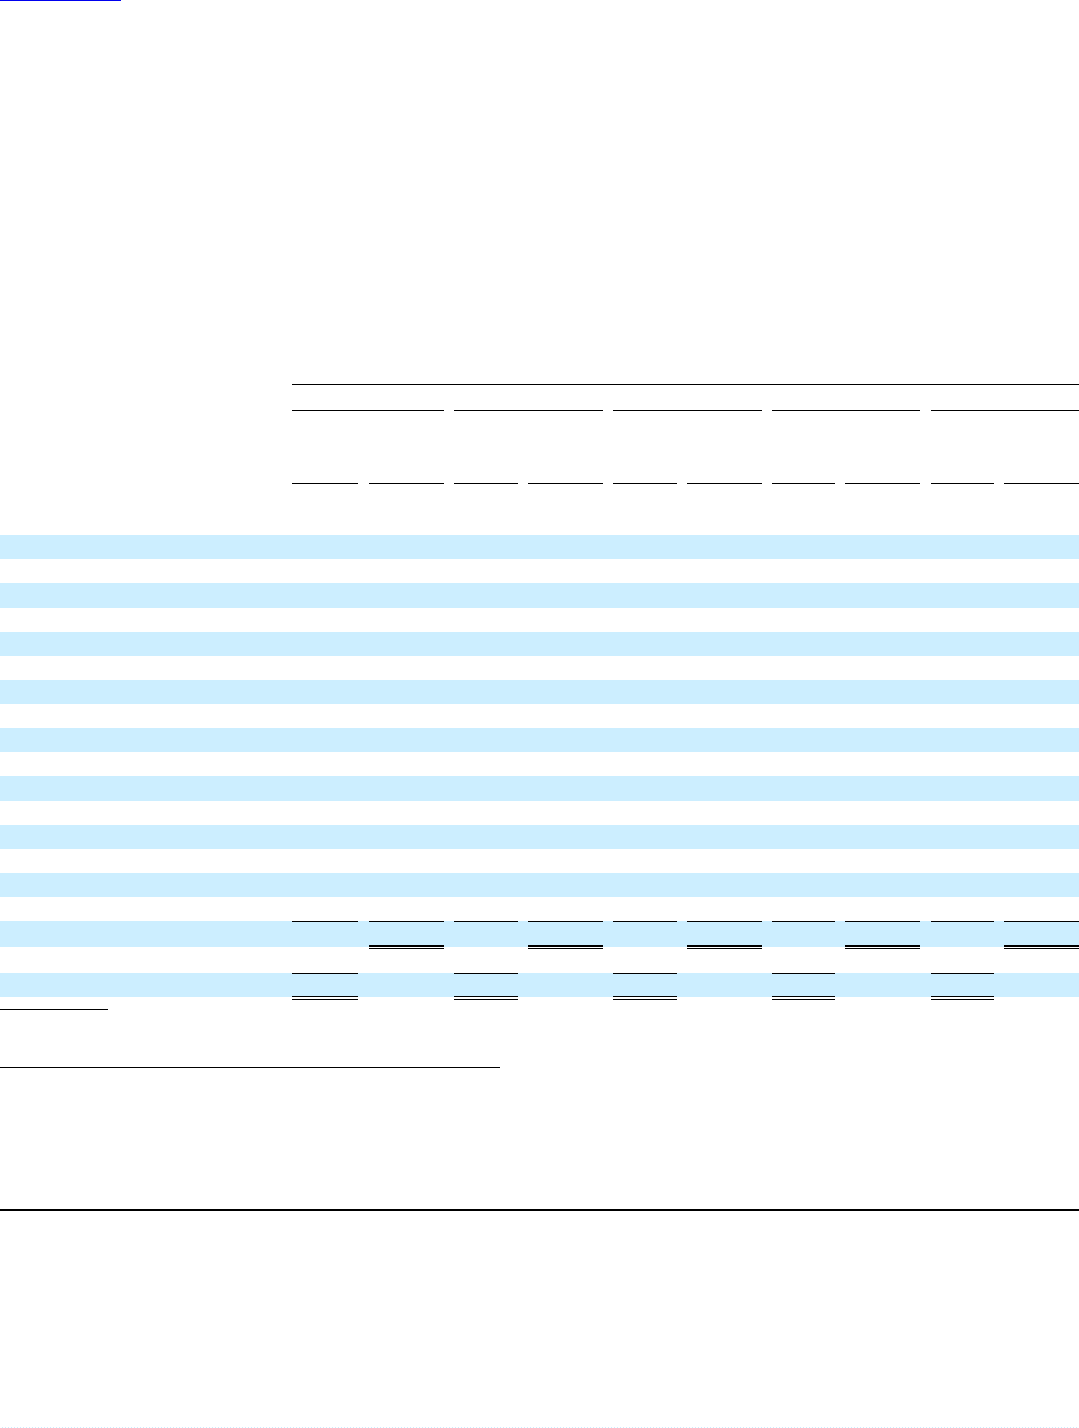
The following table presents an estimated allocation of the ALLL at the end of each of the last five years. This allocation of the ALLL is calculated on an
approximate basis and is not necessarily indicative of future losses or allocations. The entire amount of the allowance is available to absorb losses occurring
in any category of loans and leases. During 2013, the balance in the unallocated ALLL was incorporated into the loan portfolio segments.
Balances at end of period applicable to:
Commercial and industrial $ 466 35.8 % $ 422 34.6 % $ 454 33.2 % $ 470 33.4 % $ 433 33.9 %
CRE - income producing
properties 135 9.9 162 8.9 149 8.8 170 8.6 249 8.2
CRE - construction and
development 37 2.7 48 2.3 76 2.1 134 2.5 371 3.6
Dealer floor plan 8 0.9 10 0.9 8 0.8 2 0.4 3 0.3
Direct retail lending (1) 105 8.2 110 6.8 209 13.7 300 13.8 232 13.5
Sales finance 40 7.6 40 7.9 37 7.3 27 6.4 35 6.6
Revolving credit 104 1.8 110 2.1 115 2.1 102 2.0 112 2.1
Residential mortgage-
nonguaranteed (1) 194 21.8 217 25.1 269 20.3 296 20.3 318 18.7
Residential mortgage-
government guaranteed 23 0.6 36 0.8 62 1.0 32 0.9 47 0.5
Other lending subsidiaries 287 9.9 255 9.6 239 9.0 277 8.8 197 8.1
PCI 61 0.8 64 1.0 114 1.7 128 2.9 149 4.5
Unallocated ― ― ― ― ― ― 80 ― 110 ―
Total ALLL 1,460 100.0 % 1,474 100.0 % 1,732 100.0 % 2,018 100.0 % 2,256 100.0 %
RUFC 90 60 89 30 29
Total ACL $ 1,550 $ 1,534 $ 1,821 $ 2,048 $ 2,285
(1) During the first quarter of 2014, $8.3 billion in loans were transferred from direct retail lending to residential mortgage.
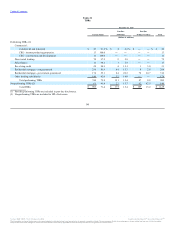
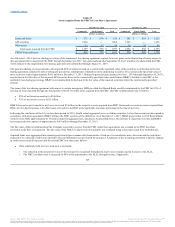
FDIC Loss Share Receivable/Payable and Asset Acquired from the FDIC
In connection with the Colonial acquisition, Branch Bank entered into loss sharing agreements with the FDIC that outline the terms and conditions under
which the FDIC will reimburse Branch Bank for a portion of the losses incurred on certain loans, OREO, investment securities and other assets. The following
table presents the carrying amount of assets by loss share agreement:
56
Source: BB&T CORP, 10-K, February 25, 2016 Powered by Morningstar® Document Research℠
The information contained herein may not be copied, adapted or distributed and is not warranted to be accurate, complete or timely. The user assumes all risks for any damages or losses arising from any use of this information,
except to the extent such damages or losses cannot be limited or excluded by applicable law. Past financial performance is no guarantee of future results.