BB&T 2015 Annual Report Download - page 68
Download and view the complete annual report
Please find page 68 of the 2015 BB&T annual report below. You can navigate through the pages in the report by either clicking on the pages listed below, or by using the keyword search tool below to find specific information within the annual report.-
 1
1 -
2
-
3
-
4
-
5
-
6
-
7
-
8
-
9
-
10
-
11
-
12
-
13
-
14
-
15
-
16
-
17
-
18
-
19
-
20
-
21
-
22
-
23
-
24
-
25
-
26
-
27
-
28
-
29
-
30
-
31
-
32
-
33
-
34
-
35
-
36
-
37
-
38
-
39
-
40
-
41
-
42
-
43
-
44
-
45
-
46
-
47
-
48
-
49
-
50
-
51
-
52
-
53
-
54
-
55
-
56
-
57
-
 58
58 -
 59
59 -
 60
60 -
 61
61 -
 62
62 -
 63
63 -
 64
64 -
 65
65 -
 66
66 -
 67
67 -
 68
68 -
 69
69 -
 70
70 -
 71
71 -
 72
72 -
 73
73 -
 74
74 -
 75
75 -
 76
76 -
 77
77 -
 78
78 -
79
-
80
-
81
-
82
-
83
-
84
-
85
-
86
-
87
-
88
-
89
-
90
-
91
-
92
-
93
-
94
-
95
-
96
-
97
-
98
-
99
-
100
-
101
-
102
-
103
-
104
-
105
-
106
-
107
-
108
-
109
-
110
-
111
-
112
-
113
-
114
-
115
-
116
-
117
-
118
-
119
-
120
-
121
-
122
-
123
-
124
-
125
-
126
-
127
-
128
-
129
-
130
-
131
-
132
-
133
-
134
-
135
-
136
-
137
-
138
-
139
-
140
-
141
-
142
-
143
-
144
-
145
-
146
-
147
-
148
-
149
-
150
-
151
-
152
-
153
-
154
-
155
-
156
-
157
-
158
-
159
-
160
-
161
-
162
-
163
-
164
-
165
-
166
-
167
-
168
-
169
-
170
-
171
-
172
-
173
-
174
-
175
-
176
-
177
-
178
-
179
-
180
-
181
-
182
-
183
-
184
-
185
-
186
-
187
-
188
-
189
-
190
-
191
-
192
-
193
-
194
-
195
-
196
-
197
-
198
-
199
-
200
-
201
-
202
-
203
-
204
-
205
-
206
-
207
-
208
-
209
-
210
-
211
-
212
-
213
-
214
-
215
-
216
-
217
-
218
-
219
-
220
-
221
-
222
-
223
-
224
-
225
-
226
-
227
-
228
-
229
-
230
-
231
-
232
-
233
-
234
-
235
-
236
-
237
-
238
-
239
-
240
-
241
-
242
-
243
-
244
-
245
-
246
-
247
-
248
-
249
-
250
-
251
-
252
-
253
-
254
-
255
-
256
-
257
-
258
-
259
-
260
-
261
-
262
-
263
-
264
-
265
-
266
-
267
-
268
-
269
-
270
-
271
-
272
-
273
-
274
-
275
-
276
-
277
-
278
-
279
-
280
-
281
-
282
-
283
-
284
-
285
-
286
-
287
-
288
-
289
-
290
-
291
-
292
-
293
-
294
-
295
-
296
-
297
-
298
-
299
-
300
-
301
-
302
-
303
-
304
-
305
-
306
-
307
-
308
-
309
-
310
-
311
-
312
-
313
-
314
-
315
-
316
-
317
-
318
-
319
-
320
-
321
-
322
-
323
-
324
-
325
-
326
-
327
-
328
-
329
-
330
-
331
-
332
-
333
-
334
-
335
-
336
-
337
-
338
-
339
-
340
-
341
-
342
-
343
-
344
-
345
-
346
-
347
-
348
-
349
-
350
-
351
-
352
-
353
-
354
-
355
-
356
-
357
-
358
-
359
-
360
-
361
-
362
-
363
-
364
-
365
-
366
-
367
-
368
-
369
-
370
 |
 |

TableofContents
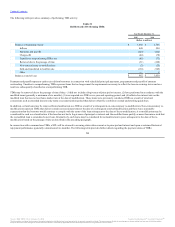
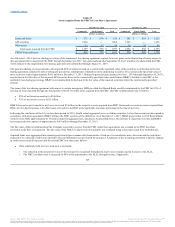
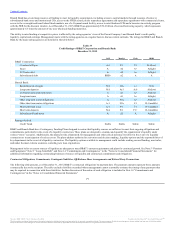
Exclusive of hedge basis adjustments, FHLB advances represented 24.0% of total outstanding long-term debt at December 31, 2015, compared to 28.5% at
December 31, 2014. FHLB advances are long-term funding sources that provide flexibility to structure the debt in a manner that aids in the management of
interest rate risk and liquidity.
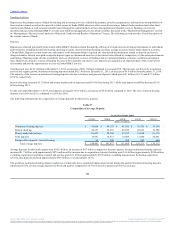
Shareholders’ Equity
Shareholders’ equity totaled $27.3 billion at December 31, 2015, an increase of $3.0 billion, or 12.2%, from year-end 2014. Book value per common share at
December 31, 2015 was $31.66, compared to $30.09 at December 31, 2014.
Shareholders’ equity increased due to net income in excess of dividends declared of $1.2 billion, as well as $2.2 billion of shares issued in connection with
acquisitions. Additionally, there were $88 million of issuances of shares and other transactions in connection with equity-based compensation plans, the
401(k) plan and the dividend reinvestment plan.
These increases were partially offset by a $222 million reduction to equity in connection with the AmRisc transaction. Additionally, the net loss in AOCI
increased $277 million, primarily due to a $186 million after-tax net decrease in the value of the AFS securities portfolio and a $97 million after-tax pension
impact.
Tangible book value per common share at December 31, 2015 was $19.82 compared to $19.86 at December 31, 2014. As of December 31, 2015, measures of
tangible capital were not required by the regulators and, therefore, were considered non-GAAP measures. Refer to the section titled “Capital” herein for a
discussion of how BB&T calculates and uses these measures in the evaluation of the Company.
Risk Management
BB&T has a strong and consistent risk culture, based on established risk values, which promotes predictable and consistent performance within an
environment of open communication and effective challenge. The strong culture influences all associates in the organization daily and helps them evaluate
whether risks are acceptable or unacceptable while making decisions that balance quality, profitability and growth appropriately. BB&T’s effective risk
management framework establishes an environment which enables it to achieve superior performance relative to peers, ensures that BB&T is viewed among
the safest of banks and assures the operational freedom to act on opportunities.
BB&T ensures that there is an appropriate return for the amount of risk taken, and that the expected return is in line with its strategic objectives and business
plan. Risk-taking activities are evaluated and prioritized to identify those that present attractive risk-adjusted returns while preserving asset value. BB&T
only undertakes risks that are understood and can be managed effectively. By managing risk well, BB&T ensures sufficient capital is available to maintain
and grow core business operations in a safe and sound manner.
Regardless of financial gain or loss to the Company, associates are held accountable if they do not follow the established risk management policies and
procedures. Compensation decisions take into account an associate’s adherence to, and successful implementation of, BB&T’s risk values. The compensation
structure supports the Company’s core values and sound risk management practices in an effort to promote judicious risk-taking behavior.
BB&T’s risk culture encourages transparency and open dialogue between all levels in the performance of organizational functions, such as the development,
marketing and implementation of a product or service.
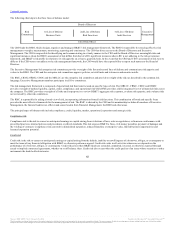
BB&T has established a risk management framework based on a “three lines of defense” model:
·First Line of Defense: Risk management begins with the BUs, the point at which risk is originated and where risks must be managed. Business unit
managers in the first line identify, assess, control and report their group’s risk profile compared to its approved risk limits.
·Second Line of Defense: The RMO provides independent oversight and guidance of risk-taking across the enterprise. The RMO aggregates,
integrates, and correlates risk information into a holistic picture of the corporation’s risk profile and concentrations. The RMO establishes policies
and limits and reports sources and amounts of risk to Executive Management and the Board of Directors.
·Third Line of Defense: Audit Services (BB&T’s internal audit function) evaluates the design and effectiveness of the risk management framework
and its results. Results are reported to Executive Management and the Board of Directors according to Audit Services Policy.
61
Source: BB&T CORP, 10-K, February 25, 2016 Powered by Morningstar® Document Research℠
The information contained herein may not be copied, adapted or distributed and is not warranted to be accurate, complete or timely. The user assumes all risks for any damages or losses arising from any use of this information,
except to the extent such damages or losses cannot be limited or excluded by applicable law. Past financial performance is no guarantee of future results.