BB&T 2015 Annual Report Download - page 52
Download and view the complete annual report
Please find page 52 of the 2015 BB&T annual report below. You can navigate through the pages in the report by either clicking on the pages listed below, or by using the keyword search tool below to find specific information within the annual report.-
 1
1 -
2
-
3
-
4
-
5
-
6
-
7
-
8
-
9
-
10
-
11
-
12
-
13
-
14
-
15
-
16
-
17
-
18
-
19
-
20
-
21
-
22
-
23
-
24
-
25
-
26
-
27
-
28
-
29
-
30
-
31
-
32
-
33
-
34
-
35
-
36
-
37
-
38
-
39
-
40
-
41
-
 42
42 -
 43
43 -
 44
44 -
 45
45 -
 46
46 -
 47
47 -
 48
48 -
 49
49 -
 50
50 -
 51
51 -
 52
52 -
 53
53 -
 54
54 -
 55
55 -
 56
56 -
 57
57 -
 58
58 -
 59
59 -
 60
60 -
 61
61 -
 62
62 -
63
-
64
-
65
-
66
-
67
-
68
-
69
-
70
-
71
-
72
-
73
-
74
-
75
-
76
-
77
-
78
-
79
-
80
-
81
-
82
-
83
-
84
-
85
-
86
-
87
-
88
-
89
-
90
-
91
-
92
-
93
-
94
-
95
-
96
-
97
-
98
-
99
-
100
-
101
-
102
-
103
-
104
-
105
-
106
-
107
-
108
-
109
-
110
-
111
-
112
-
113
-
114
-
115
-
116
-
117
-
118
-
119
-
120
-
121
-
122
-
123
-
124
-
125
-
126
-
127
-
128
-
129
-
130
-
131
-
132
-
133
-
134
-
135
-
136
-
137
-
138
-
139
-
140
-
141
-
142
-
143
-
144
-
145
-
146
-
147
-
148
-
149
-
150
-
151
-
152
-
153
-
154
-
155
-
156
-
157
-
158
-
159
-
160
-
161
-
162
-
163
-
164
-
165
-
166
-
167
-
168
-
169
-
170
-
171
-
172
-
173
-
174
-
175
-
176
-
177
-
178
-
179
-
180
-
181
-
182
-
183
-
184
-
185
-
186
-
187
-
188
-
189
-
190
-
191
-
192
-
193
-
194
-
195
-
196
-
197
-
198
-
199
-
200
-
201
-
202
-
203
-
204
-
205
-
206
-
207
-
208
-
209
-
210
-
211
-
212
-
213
-
214
-
215
-
216
-
217
-
218
-
219
-
220
-
221
-
222
-
223
-
224
-
225
-
226
-
227
-
228
-
229
-
230
-
231
-
232
-
233
-
234
-
235
-
236
-
237
-
238
-
239
-
240
-
241
-
242
-
243
-
244
-
245
-
246
-
247
-
248
-
249
-
250
-
251
-
252
-
253
-
254
-
255
-
256
-
257
-
258
-
259
-
260
-
261
-
262
-
263
-
264
-
265
-
266
-
267
-
268
-
269
-
270
-
271
-
272
-
273
-
274
-
275
-
276
-
277
-
278
-
279
-
280
-
281
-
282
-
283
-
284
-
285
-
286
-
287
-
288
-
289
-
290
-
291
-
292
-
293
-
294
-
295
-
296
-
297
-
298
-
299
-
300
-
301
-
302
-
303
-
304
-
305
-
306
-
307
-
308
-
309
-
310
-
311
-
312
-
313
-
314
-
315
-
316
-
317
-
318
-
319
-
320
-
321
-
322
-
323
-
324
-
325
-
326
-
327
-
328
-
329
-
330
-
331
-
332
-
333
-
334
-
335
-
336
-
337
-
338
-
339
-
340
-
341
-
342
-
343
-
344
-
345
-
346
-
347
-
348
-
349
-
350
-
351
-
352
-
353
-
354
-
355
-
356
-
357
-
358
-
359
-
360
-
361
-
362
-
363
-
364
-
365
-
366
-
367
-
368
-
369
-
370
 |
 |

TableofContents
Lending Activities
The primary goal of the BB&T lending function is to help clients achieve their financial goals by providing quality loan products that are fair to the client
and profitable to the Company. Management believes that this purpose can best be accomplished by building strong, profitable client relationships over
time, with BB&T becoming an important contributor to the prosperity and well-being of its clients. In addition to the importance placed on client knowledge
and continuous involvement with clients, BB&T’s lending process incorporates the standards of a consistent company-wide credit culture and an in-depth
local market knowledge. Furthermore, the Company employs strict underwriting criteria governing the degree of assumed risk and the diversity of the loan
portfolio in terms of type, industry and geographical concentration. In this context, BB&T strives to meet the credit needs of clients in its markets while
pursuing a balanced strategy of loan profitability, loan growth and loan quality.
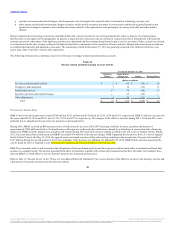
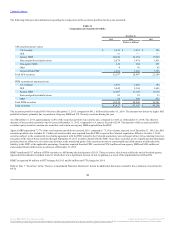
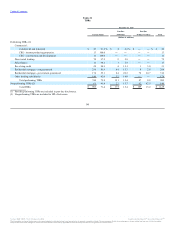
Commercial:
Commercial and industrial $ 48,047 $ 46,462 $ 42,541 $ 41,448 $ 40,383
CRE - income producing properties 13,264 12,514 10,730 10,680 10,681
CRE - construction and development 3,766 3,502 2,767 2,734 2,772
Dealer floor plan 1,164 1,056 1,010 1,040 1,053
Direct retail lending 10,896 9,926 8,449 8,191 8,085
Sales finance 10,533 10,386 9,507 9,458 9,194
Revolving credit 2,458 2,421 2,365 2,385 2,427
Residential mortgage 30,334 30,384 29,862 30,427 31,046
Other lending subsidiaries 13,281 12,837 11,701 11,318 11,351
PCI 1,070 1,052 1,055 1,156 1,309
Total average loans and leases HFI 134,813 130,540 119,987 118,837 118,301
LHFS 1,377 1,959 2,069 1,398 1,611
Total average loans and leases $ 136,190 $ 132,499 $ 122,056 $ 120,235 $ 119,912
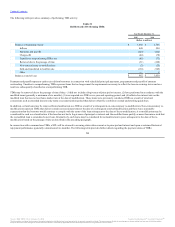
Average loans held for investment for the fourth quarter of 2015 were $134.8 billion, up $4.3 billion compared to the third quarter of 2015. Excluding
acquisitions (which comprises Susquehanna, The Bank of Kentucky, both branch acquisitions in Texas and BankAtlantic), average loans held for investment
were up approximately 2.0% on an annualized basis.
Average commercial and industrial loans increased $1.6 billion during the fourth quarter of 2015. Approximately $740 million of the increase was the result
of acquisitions while the remaining increase primarily reflects continued growth in large corporate lending. Average commercial real estate – income
producing properties loans increased $750 million and average commercial real estate – construction and development loans increased $264 million, with
the majority of both of these increases being attributable to acquisitions. Dealer floor plan average loans, which were not significantly impacted by
acquisition activity, were up $108 million or 40.6% annualized, due to strong organic growth.
Direct retail lending average loans increased $970 million; approximately $735 million of the growth was due to acquisitions. Other lending subsidiaries
average loans increased $444 million, with approximately half of the increase due to acquisitions.
Excluding acquisition activity, average sales finance loans declined approximately $400 million, which is partially due to dealer pricing structure changes
implemented during the third quarter. Average residential mortgage loans decreased approximately $430 million excluding acquisitions, which reflects the
continued strategy to sell conforming residential mortgage loan production.
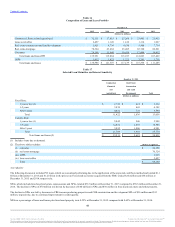
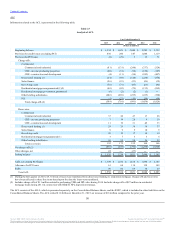
The following table excludes sales finance and retail other lending subsidiaries loans as the substantial majority of those loans have fixed interest rates:
46
Source: BB&T CORP, 10-K, February 25, 2016 Powered by Morningstar® Document Research℠
The information contained herein may not be copied, adapted or distributed and is not warranted to be accurate, complete or timely. The user assumes all risks for any damages or losses arising from any use of this information,
except to the extent such damages or losses cannot be limited or excluded by applicable law. Past financial performance is no guarantee of future results.