BB&T 2015 Annual Report Download - page 45
Download and view the complete annual report
Please find page 45 of the 2015 BB&T annual report below. You can navigate through the pages in the report by either clicking on the pages listed below, or by using the keyword search tool below to find specific information within the annual report.-
 1
1 -
2
-
3
-
4
-
5
-
6
-
7
-
8
-
9
-
10
-
11
-
12
-
13
-
14
-
15
-
16
-
17
-
18
-
19
-
20
-
21
-
22
-
23
-
24
-
25
-
26
-
27
-
28
-
29
-
30
-
31
-
32
-
33
-
34
-
 35
35 -
 36
36 -
 37
37 -
 38
38 -
 39
39 -
 40
40 -
 41
41 -
 42
42 -
 43
43 -
 44
44 -
 45
45 -
 46
46 -
 47
47 -
 48
48 -
 49
49 -
 50
50 -
 51
51 -
 52
52 -
 53
53 -
 54
54 -
 55
55 -
56
-
57
-
58
-
59
-
60
-
61
-
62
-
63
-
64
-
65
-
66
-
67
-
68
-
69
-
70
-
71
-
72
-
73
-
74
-
75
-
76
-
77
-
78
-
79
-
80
-
81
-
82
-
83
-
84
-
85
-
86
-
87
-
88
-
89
-
90
-
91
-
92
-
93
-
94
-
95
-
96
-
97
-
98
-
99
-
100
-
101
-
102
-
103
-
104
-
105
-
106
-
107
-
108
-
109
-
110
-
111
-
112
-
113
-
114
-
115
-
116
-
117
-
118
-
119
-
120
-
121
-
122
-
123
-
124
-
125
-
126
-
127
-
128
-
129
-
130
-
131
-
132
-
133
-
134
-
135
-
136
-
137
-
138
-
139
-
140
-
141
-
142
-
143
-
144
-
145
-
146
-
147
-
148
-
149
-
150
-
151
-
152
-
153
-
154
-
155
-
156
-
157
-
158
-
159
-
160
-
161
-
162
-
163
-
164
-
165
-
166
-
167
-
168
-
169
-
170
-
171
-
172
-
173
-
174
-
175
-
176
-
177
-
178
-
179
-
180
-
181
-
182
-
183
-
184
-
185
-
186
-
187
-
188
-
189
-
190
-
191
-
192
-
193
-
194
-
195
-
196
-
197
-
198
-
199
-
200
-
201
-
202
-
203
-
204
-
205
-
206
-
207
-
208
-
209
-
210
-
211
-
212
-
213
-
214
-
215
-
216
-
217
-
218
-
219
-
220
-
221
-
222
-
223
-
224
-
225
-
226
-
227
-
228
-
229
-
230
-
231
-
232
-
233
-
234
-
235
-
236
-
237
-
238
-
239
-
240
-
241
-
242
-
243
-
244
-
245
-
246
-
247
-
248
-
249
-
250
-
251
-
252
-
253
-
254
-
255
-
256
-
257
-
258
-
259
-
260
-
261
-
262
-
263
-
264
-
265
-
266
-
267
-
268
-
269
-
270
-
271
-
272
-
273
-
274
-
275
-
276
-
277
-
278
-
279
-
280
-
281
-
282
-
283
-
284
-
285
-
286
-
287
-
288
-
289
-
290
-
291
-
292
-
293
-
294
-
295
-
296
-
297
-
298
-
299
-
300
-
301
-
302
-
303
-
304
-
305
-
306
-
307
-
308
-
309
-
310
-
311
-
312
-
313
-
314
-
315
-
316
-
317
-
318
-
319
-
320
-
321
-
322
-
323
-
324
-
325
-
326
-
327
-
328
-
329
-
330
-
331
-
332
-
333
-
334
-
335
-
336
-
337
-
338
-
339
-
340
-
341
-
342
-
343
-
344
-
345
-
346
-
347
-
348
-
349
-
350
-
351
-
352
-
353
-
354
-
355
-
356
-
357
-
358
-
359
-
360
-
361
-
362
-
363
-
364
-
365
-
366
-
367
-
368
-
369
-
370
 |
 |

TableofContents
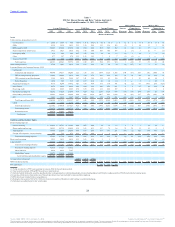
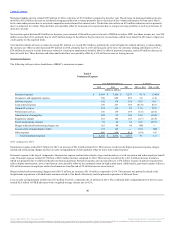
Segment net interest income increased $53 million to $728 million, primarily driven by growth in the Dealer Finance and Regional Acceptance loan
portfolios, the inclusion of dealer floor plan loans in the segment results beginning in the first quarter of 2015 and the acquisition of Susquehanna’s
consumer auto leasing business.
The allocated provision for credit losses increased $17 million, primarily due to higher charge-offs. Noninterest expense increased $37 million driven by
higher personnel, professional services, loan processing and other expenses.
Dealer Financial Services grew average loans by $911 million, or 7.1%, compared to 2014 as a result of strong growth in the prime and nonprime auto
lending businesses and the acquisition of Susquehanna’s consumer auto leasing business.
Specialized Lending
Specialized Lending net income was $268 million in 2015, an increase of $11 million, or 4.3%, compared to 2014.
Segment net interest income increased $33 million to $465 million, driven by strong growth in small ticket consumer loans and the acquisition of
Susquehanna’s small business equipment finance portfolio, partially offset by lower rates on new loans. Noninterest income increased $39 million driven by
higher commercial mortgage and operating lease income.
The allocated provision for credit losses increased $9 million, primarily due to higher net charge-offs in the small ticket consumer and commercial finance
loan portfolios. Noninterest expense increased $45 million, primarily due to higher personnel expense and higher depreciation of property under operating
leases.
Specialized Lending grew average loans by $2.0 billion, or 12.7%, compared to 2014 as a result of strong growth in small ticket consumer, commercial
mortgage and governmental finance loans and the acquisition of the small business equipment finance portfolio.
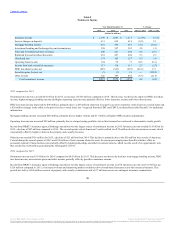
Insurance Services
Insurance Services net income was $182 million in 2015, a decrease of $51 million, or 21.9%, compared to 2014.
Insurance Service’s noninterest income of $1.6 billion decreased $55 million, which primarily reflects lower direct commercial property and casualty
insurance premiums due to the previously discussed sale of American Coastal, partially offset by higher new and renewal commercial property and casualty
insurance business.
Noninterest expense increased $2 million driven by higher salary, employee insurance and pension expense as well as higher merger-related charges,
partially offset by lower business referral and insurance claims expense. Allocated corporate expenses increased $13 million primarily due to the
centralization of certain corporate support functions during mid-2014.
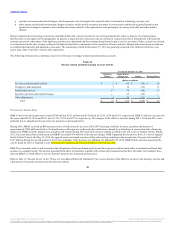
Financial Services
Financial Services net income was $319 million in 2015, an increase of $37 million, or 13.1%, compared to 2014.
Segment net interest income increased $80 million to $526 million, driven by Corporate Banking and BB&T Wealth loan and deposit growth, partially offset
by lower rates on new loans. Noninterest income increased $68 million as a result of higher investment commissions and brokerage fees, trust and investment
advisory fees, commercial unused commitment fees and income from SBIC private equity investments. Client invested assets totaled $130.6 billion as of
December 31, 2015, an increase of $11.7 billion, or 9.8%, compared to 2014.
The allocated provision for credit losses increased $40 million as a result of the Corporate Banking loan growth, portfolio mix and risk expectations related
to the oil and energy sector. Noninterest expense increased $46 million compared to 2014, driven by higher salary, incentive, pension and professional
services expense.
Financial Services continues to generate significant loan growth through expanded lending strategies, with Corporate Banking’s average loan balances
increasing $2.6 billion, or 28.4%, compared to 2014, while BB&T Wealth’s average loan balances increased $367 million, or 32.7%. BB&T Wealth also
grew transaction account balances by $595 million, or 21.5%, and money market and savings balances by $974 million, or 14.5%, compared to 2014,
partially attributable to the ongoing identification and servicing of wealth clients in the Community Bank.
40
Source: BB&T CORP, 10-K, February 25, 2016 Powered by Morningstar® Document Research℠
The information contained herein may not be copied, adapted or distributed and is not warranted to be accurate, complete or timely. The user assumes all risks for any damages or losses arising from any use of this information,
except to the extent such damages or losses cannot be limited or excluded by applicable law. Past financial performance is no guarantee of future results.