BB&T 2015 Annual Report Download - page 49
Download and view the complete annual report
Please find page 49 of the 2015 BB&T annual report below. You can navigate through the pages in the report by either clicking on the pages listed below, or by using the keyword search tool below to find specific information within the annual report.-
 1
1 -
2
-
3
-
4
-
5
-
6
-
7
-
8
-
9
-
10
-
11
-
12
-
13
-
14
-
15
-
16
-
17
-
18
-
19
-
20
-
21
-
22
-
23
-
24
-
25
-
26
-
27
-
28
-
29
-
30
-
31
-
32
-
33
-
34
-
35
-
36
-
37
-
38
-
 39
39 -
 40
40 -
 41
41 -
 42
42 -
 43
43 -
 44
44 -
 45
45 -
 46
46 -
 47
47 -
 48
48 -
 49
49 -
 50
50 -
 51
51 -
 52
52 -
 53
53 -
 54
54 -
 55
55 -
 56
56 -
 57
57 -
 58
58 -
 59
59 -
60
-
61
-
62
-
63
-
64
-
65
-
66
-
67
-
68
-
69
-
70
-
71
-
72
-
73
-
74
-
75
-
76
-
77
-
78
-
79
-
80
-
81
-
82
-
83
-
84
-
85
-
86
-
87
-
88
-
89
-
90
-
91
-
92
-
93
-
94
-
95
-
96
-
97
-
98
-
99
-
100
-
101
-
102
-
103
-
104
-
105
-
106
-
107
-
108
-
109
-
110
-
111
-
112
-
113
-
114
-
115
-
116
-
117
-
118
-
119
-
120
-
121
-
122
-
123
-
124
-
125
-
126
-
127
-
128
-
129
-
130
-
131
-
132
-
133
-
134
-
135
-
136
-
137
-
138
-
139
-
140
-
141
-
142
-
143
-
144
-
145
-
146
-
147
-
148
-
149
-
150
-
151
-
152
-
153
-
154
-
155
-
156
-
157
-
158
-
159
-
160
-
161
-
162
-
163
-
164
-
165
-
166
-
167
-
168
-
169
-
170
-
171
-
172
-
173
-
174
-
175
-
176
-
177
-
178
-
179
-
180
-
181
-
182
-
183
-
184
-
185
-
186
-
187
-
188
-
189
-
190
-
191
-
192
-
193
-
194
-
195
-
196
-
197
-
198
-
199
-
200
-
201
-
202
-
203
-
204
-
205
-
206
-
207
-
208
-
209
-
210
-
211
-
212
-
213
-
214
-
215
-
216
-
217
-
218
-
219
-
220
-
221
-
222
-
223
-
224
-
225
-
226
-
227
-
228
-
229
-
230
-
231
-
232
-
233
-
234
-
235
-
236
-
237
-
238
-
239
-
240
-
241
-
242
-
243
-
244
-
245
-
246
-
247
-
248
-
249
-
250
-
251
-
252
-
253
-
254
-
255
-
256
-
257
-
258
-
259
-
260
-
261
-
262
-
263
-
264
-
265
-
266
-
267
-
268
-
269
-
270
-
271
-
272
-
273
-
274
-
275
-
276
-
277
-
278
-
279
-
280
-
281
-
282
-
283
-
284
-
285
-
286
-
287
-
288
-
289
-
290
-
291
-
292
-
293
-
294
-
295
-
296
-
297
-
298
-
299
-
300
-
301
-
302
-
303
-
304
-
305
-
306
-
307
-
308
-
309
-
310
-
311
-
312
-
313
-
314
-
315
-
316
-
317
-
318
-
319
-
320
-
321
-
322
-
323
-
324
-
325
-
326
-
327
-
328
-
329
-
330
-
331
-
332
-
333
-
334
-
335
-
336
-
337
-
338
-
339
-
340
-
341
-
342
-
343
-
344
-
345
-
346
-
347
-
348
-
349
-
350
-
351
-
352
-
353
-
354
-
355
-
356
-
357
-
358
-
359
-
360
-
361
-
362
-
363
-
364
-
365
-
366
-
367
-
368
-
369
-
370
 |
 |

TableofContents
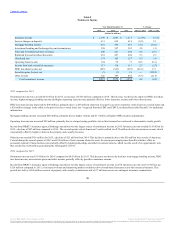
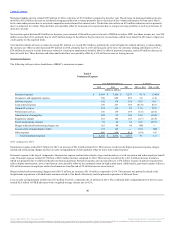
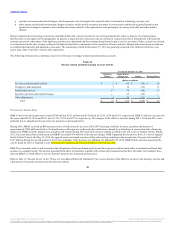
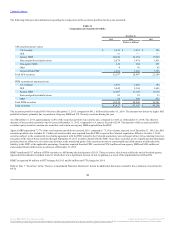
The following table provides information regarding the composition of the securities portfolio for the years presented:
AFS securities (at fair value):
U.S. Treasury $ 1,832 $ 1,231 $ 595
GSE 51 ― ―
Agency MBS 20,046 16,154 17,929
States and political subdivisions 2,079 1,974 1,851
Non-agency MBS 221 264 291
Other 4 41 45
Acquired from FDIC 1,064 1,243 1,393
Total AFS securities 25,297 20,907 22,104
HTM securities (at amortized cost):
U.S. Treasury 1,097 1,096 392
GSE 5,045 5,394 5,603
Agency MBS 12,267 13,120 11,636
States and political subdivisions 63 22 33
Other 58 608 437
Total HTM securities 18,530 20,240 18,101
Total securities $ 43,827 $ 41,147 $ 40,205
The securities portfolio totaled $43.8 billion at December 31, 2015, compared to $41.1 billion at December 31, 2014. The increase was driven by higher AFS
portfolio balances, primarily due to purchases of agency MBS and U.S. Treasury securities during the year.
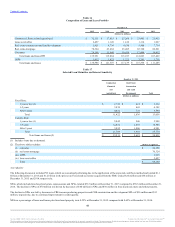
As of December 31, 2015, approximately 12.4% of the securities portfolio was variable rate, compared to 14.0% as of December 31, 2014. The effective
duration of the securities portfolio was 4.0 years at December 31, 2015, compared to 3.9 years at the end of 2014. The duration of the securities portfolio
excludes equity securities, auction rate securities, and certain non-agency MBS acquired from the FDIC.
Agency MBS represented 73.7% of the total securities portfolio at year-end 2015, compared to 71.1% as of prior year end. As of December 31, 2015, the AFS
securities portfolio also includes $1.1 billion of securities that were acquired from the FDIC as part of the Colonial acquisition. Effective October 1, 2014,
securities subject to the commercial loss sharing agreement with the FDIC related to the Colonial acquisition were no longer subject to loss sharing; however,
any gains on the sale of these securities through September 30, 2017 would be shared with the FDIC. Since these securities are in a significant unrealized gain
position, they are effectively covered as any declines in the unrealized gains of the securities down to a contractually specified amount would reduce the
liability to the FDIC at the applicable percentage. Securities acquired from the FDIC consisted of $768 million of non-agency MBS and $296 million of
states and political subdivisions securities as of December 31, 2015.
BB&T transferred $517 million of HTM securities to AFS during the third quarter of 2015. These securities, which were sold by the end of the third quarter,
represented investments in student loans for which there was a significant increase in risk weighting as a result of the implementation of Basel III.
BB&T recognized $4 million in OTTI charges for 2015 and $6 million in OTTI charges for 2014.
Refer to Note 3 “Securities” in the “Notes to Consolidated Financial Statements” herein for additional disclosures related to the evaluation of securities for
OTTI.
44
Source: BB&T CORP, 10-K, February 25, 2016 Powered by Morningstar® Document Research℠
The information contained herein may not be copied, adapted or distributed and is not warranted to be accurate, complete or timely. The user assumes all risks for any damages or losses arising from any use of this information,
except to the extent such damages or losses cannot be limited or excluded by applicable law. Past financial performance is no guarantee of future results.