BB&T 2015 Annual Report Download - page 115
Download and view the complete annual report
Please find page 115 of the 2015 BB&T annual report below. You can navigate through the pages in the report by either clicking on the pages listed below, or by using the keyword search tool below to find specific information within the annual report.-
 1
1 -
2
-
3
-
4
-
5
-
6
-
7
-
8
-
9
-
10
-
11
-
12
-
13
-
14
-
15
-
16
-
17
-
18
-
19
-
20
-
21
-
22
-
23
-
24
-
25
-
26
-
27
-
28
-
29
-
30
-
31
-
32
-
33
-
34
-
35
-
36
-
37
-
38
-
39
-
40
-
41
-
42
-
43
-
44
-
45
-
46
-
47
-
48
-
49
-
50
-
51
-
52
-
53
-
54
-
55
-
56
-
57
-
58
-
59
-
60
-
61
-
62
-
63
-
64
-
65
-
66
-
67
-
68
-
69
-
70
-
71
-
72
-
73
-
74
-
75
-
76
-
77
-
78
-
79
-
80
-
81
-
82
-
83
-
84
-
85
-
86
-
87
-
88
-
89
-
90
-
91
-
92
-
93
-
94
-
95
-
96
-
97
-
98
-
99
-
100
-
101
-
102
-
103
-
104
-
 105
105 -
 106
106 -
 107
107 -
 108
108 -
 109
109 -
 110
110 -
 111
111 -
 112
112 -
 113
113 -
 114
114 -
 115
115 -
 116
116 -
 117
117 -
 118
118 -
 119
119 -
 120
120 -
 121
121 -
 122
122 -
 123
123 -
 124
124 -
 125
125 -
126
-
127
-
128
-
129
-
130
-
131
-
132
-
133
-
134
-
135
-
136
-
137
-
138
-
139
-
140
-
141
-
142
-
143
-
144
-
145
-
146
-
147
-
148
-
149
-
150
-
151
-
152
-
153
-
154
-
155
-
156
-
157
-
158
-
159
-
160
-
161
-
162
-
163
-
164
-
165
-
166
-
167
-
168
-
169
-
170
-
171
-
172
-
173
-
174
-
175
-
176
-
177
-
178
-
179
-
180
-
181
-
182
-
183
-
184
-
185
-
186
-
187
-
188
-
189
-
190
-
191
-
192
-
193
-
194
-
195
-
196
-
197
-
198
-
199
-
200
-
201
-
202
-
203
-
204
-
205
-
206
-
207
-
208
-
209
-
210
-
211
-
212
-
213
-
214
-
215
-
216
-
217
-
218
-
219
-
220
-
221
-
222
-
223
-
224
-
225
-
226
-
227
-
228
-
229
-
230
-
231
-
232
-
233
-
234
-
235
-
236
-
237
-
238
-
239
-
240
-
241
-
242
-
243
-
244
-
245
-
246
-
247
-
248
-
249
-
250
-
251
-
252
-
253
-
254
-
255
-
256
-
257
-
258
-
259
-
260
-
261
-
262
-
263
-
264
-
265
-
266
-
267
-
268
-
269
-
270
-
271
-
272
-
273
-
274
-
275
-
276
-
277
-
278
-
279
-
280
-
281
-
282
-
283
-
284
-
285
-
286
-
287
-
288
-
289
-
290
-
291
-
292
-
293
-
294
-
295
-
296
-
297
-
298
-
299
-
300
-
301
-
302
-
303
-
304
-
305
-
306
-
307
-
308
-
309
-
310
-
311
-
312
-
313
-
314
-
315
-
316
-
317
-
318
-
319
-
320
-
321
-
322
-
323
-
324
-
325
-
326
-
327
-
328
-
329
-
330
-
331
-
332
-
333
-
334
-
335
-
336
-
337
-
338
-
339
-
340
-
341
-
342
-
343
-
344
-
345
-
346
-
347
-
348
-
349
-
350
-
351
-
352
-
353
-
354
-
355
-
356
-
357
-
358
-
359
-
360
-
361
-
362
-
363
-
364
-
365
-
366
-
367
-
368
-
369
-
370
 |
 |

TableofContents
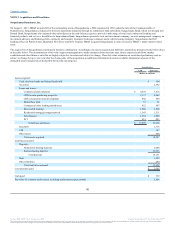
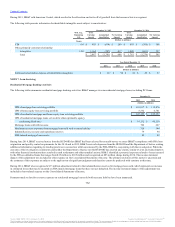
During the first quarter of 2014, approximately $8.3 billion of nonguaranteed, closed-end, first and second lien position residential mortgage loans, along
with the related allowance, were transferred from direct retail lending to residential mortgage to facilitate compliance with a series of new rules related to
mortgage servicing associated with first and second lien position mortgages collateralized by real estate.
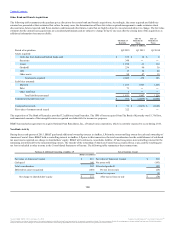
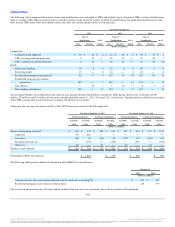
During the third quarter of 2014, approximately $550 million of loans, which were primarily performing residential mortgage TDRs, with a related ALLL of
$57 million were sold for a gain of $42 million. During the fourth quarter of 2014, approximately $140 million of loans, which were primarily residential
mortgage NPLs, with a related ALLL of $19 million were sold for a gain of $24 million. Both gains were recognized as reductions to the provision for credit
losses.
Effective October 1, 2014, loans subject to the commercial loss sharing agreement with the FDIC related to the Colonial acquisition were no longer covered
by loss sharing. At December 31, 2015, these loans had a carrying value of $273 million, a UPB of $462 million and an allowance of $41 million and are
included in PCI. Loans with a carrying value of $539 million at December 31, 2015 continue to be covered by loss sharing and are included in PCI.
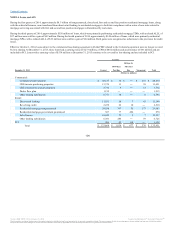
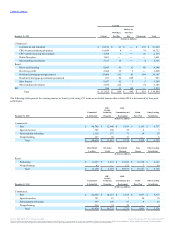
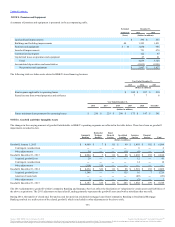
Commercial:
Commercial and industrial $ 48,157 $ 36 $ ― $ 237 $ 48,430
CRE-income producing properties 13,370 13 ― 38 13,421
CRE-construction and development 3,710 9 ― 13 3,732
Dealer floor plan 1,215 ― ― ― 1,215
Other lending subsidiaries 6,771 18 ― 6 6,795
Retail:
Direct retail lending 11,032 58 7 43 11,140
Revolving credit 2,478 22 10 ― 2,510
Residential mortgage-nonguaranteed 29,038 397 55 173 29,663
Residential mortgage-government guaranteed 307 77 486 ― 870
Sales finance 10,243 72 5 7 10,327
Other lending subsidiaries 6,381 286 ― 59 6,726
PCI 966 42 114 ― 1,122
Total $ 133,668 $ 1,030 $ 677 $ 576 $ 135,951
104
Source: BB&T CORP, 10-K, February 25, 2016 Powered by Morningstar® Document Research℠
The information contained herein may not be copied, adapted or distributed and is not warranted to be accurate, complete or timely. The user assumes all risks for any damages or losses arising from any use of this information,
except to the extent such damages or losses cannot be limited or excluded by applicable law. Past financial performance is no guarantee of future results.