BB&T 2015 Annual Report Download - page 54
Download and view the complete annual report
Please find page 54 of the 2015 BB&T annual report below. You can navigate through the pages in the report by either clicking on the pages listed below, or by using the keyword search tool below to find specific information within the annual report.-
 1
1 -
2
-
3
-
4
-
5
-
6
-
7
-
8
-
9
-
10
-
11
-
12
-
13
-
14
-
15
-
16
-
17
-
18
-
19
-
20
-
21
-
22
-
23
-
24
-
25
-
26
-
27
-
28
-
29
-
30
-
31
-
32
-
33
-
34
-
35
-
36
-
37
-
38
-
39
-
40
-
41
-
42
-
43
-
 44
44 -
 45
45 -
 46
46 -
 47
47 -
 48
48 -
 49
49 -
 50
50 -
 51
51 -
 52
52 -
 53
53 -
 54
54 -
 55
55 -
 56
56 -
 57
57 -
 58
58 -
 59
59 -
 60
60 -
 61
61 -
 62
62 -
 63
63 -
 64
64 -
65
-
66
-
67
-
68
-
69
-
70
-
71
-
72
-
73
-
74
-
75
-
76
-
77
-
78
-
79
-
80
-
81
-
82
-
83
-
84
-
85
-
86
-
87
-
88
-
89
-
90
-
91
-
92
-
93
-
94
-
95
-
96
-
97
-
98
-
99
-
100
-
101
-
102
-
103
-
104
-
105
-
106
-
107
-
108
-
109
-
110
-
111
-
112
-
113
-
114
-
115
-
116
-
117
-
118
-
119
-
120
-
121
-
122
-
123
-
124
-
125
-
126
-
127
-
128
-
129
-
130
-
131
-
132
-
133
-
134
-
135
-
136
-
137
-
138
-
139
-
140
-
141
-
142
-
143
-
144
-
145
-
146
-
147
-
148
-
149
-
150
-
151
-
152
-
153
-
154
-
155
-
156
-
157
-
158
-
159
-
160
-
161
-
162
-
163
-
164
-
165
-
166
-
167
-
168
-
169
-
170
-
171
-
172
-
173
-
174
-
175
-
176
-
177
-
178
-
179
-
180
-
181
-
182
-
183
-
184
-
185
-
186
-
187
-
188
-
189
-
190
-
191
-
192
-
193
-
194
-
195
-
196
-
197
-
198
-
199
-
200
-
201
-
202
-
203
-
204
-
205
-
206
-
207
-
208
-
209
-
210
-
211
-
212
-
213
-
214
-
215
-
216
-
217
-
218
-
219
-
220
-
221
-
222
-
223
-
224
-
225
-
226
-
227
-
228
-
229
-
230
-
231
-
232
-
233
-
234
-
235
-
236
-
237
-
238
-
239
-
240
-
241
-
242
-
243
-
244
-
245
-
246
-
247
-
248
-
249
-
250
-
251
-
252
-
253
-
254
-
255
-
256
-
257
-
258
-
259
-
260
-
261
-
262
-
263
-
264
-
265
-
266
-
267
-
268
-
269
-
270
-
271
-
272
-
273
-
274
-
275
-
276
-
277
-
278
-
279
-
280
-
281
-
282
-
283
-
284
-
285
-
286
-
287
-
288
-
289
-
290
-
291
-
292
-
293
-
294
-
295
-
296
-
297
-
298
-
299
-
300
-
301
-
302
-
303
-
304
-
305
-
306
-
307
-
308
-
309
-
310
-
311
-
312
-
313
-
314
-
315
-
316
-
317
-
318
-
319
-
320
-
321
-
322
-
323
-
324
-
325
-
326
-
327
-
328
-
329
-
330
-
331
-
332
-
333
-
334
-
335
-
336
-
337
-
338
-
339
-
340
-
341
-
342
-
343
-
344
-
345
-
346
-
347
-
348
-
349
-
350
-
351
-
352
-
353
-
354
-
355
-
356
-
357
-
358
-
359
-
360
-
361
-
362
-
363
-
364
-
365
-
366
-
367
-
368
-
369
-
370
 |
 |

TableofContents
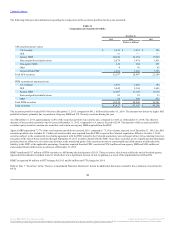
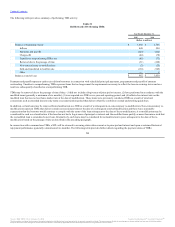
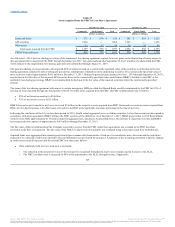
The following table presents the loan portfolio based upon BB&T’s BUs:
Commercial:
Commercial and industrial $ 48,430 $ 41,454 $ 38,508 $ 38,295 $ 36,415
CRE—income producing properties 13,421 10,722 10,228 9,861 8,860
CRE—construction and development 3,732 2,735 2,382 2,861 3,890
Dealer floor plan 1,215 1,091 904 431 345
Direct retail lending (1) 11,140 8,146 15,869 15,817 14,506
Sales finance 10,327 9,509 8,478 7,305 7,056
Revolving credit 2,510 2,460 2,403 2,330 2,212
Residential mortgage-nonguaranteed (1) 29,663 30,107 23,513 23,189 20,057
Residential mortgage-government guaranteed 870 983 1,135 1,083 524
Other lending subsidiaries 13,521 11,462 10,462 10,137 8,737
PCI 1,122 1,215 2,035 3,294 4,867
Total loans and leases HFI 135,951 119,884 115,917 114,603 107,469
LHFS 1,035 1,423 1,222 3,761 3,736
Total loans and leases $ 136,986 $ 121,307 $ 117,139 $ 118,364 $ 111,205
(1) During the first quarter of 2014, $8.3 billion of loans were transferred from direct retail lending to residential mortgage.
Total loans and leases were $137.0 billion at year-end 2015, an increase of $15.7 billion compared to the balance at year-end 2014. This increase reflects
broad-based loan growth along with the impact of acquisitions, which contributed $14.2 billion in loans as of the respective acquisition dates. Commercial
and industrial loans were up $7.0 billion, direct retail lending loans were up $3.0 billion, CRE-income producing properties loans were up $2.7 billion and
other lending subsidiaries loans were up $2.1 billion. A $557 million decline in residential mortgage balances reflects the continued strategy to sell
conforming residential mortgage loan production.
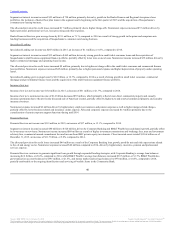
The increase in commercial and industrial loans reflects the previously mentioned acquisition activity as well as solid growth from large corporate clients,
which typically have strong credit profiles and therefore put downward pressure on pricing. The yield on commercial and industrial loans declined to 3.21%
in 2015 from 3.35% in 2014.
The PCI loan portfolio, which totaled $1.1 billion at December 31, 2015, continued to runoff during the year, partially offset by the addition of $403 million
of PCI loans in connection with the Susquehanna acquisition.
The majority of BB&T’s loans are with clients in domestic market areas, which are primarily concentrated in the southeastern United States. International
loans were immaterial as of December 31, 2015 and 2014.
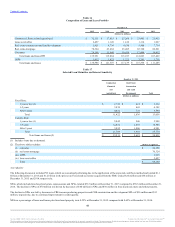
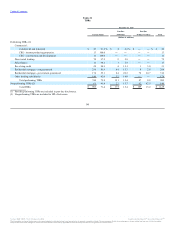
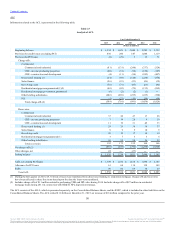
The following tables summarize the loan portfolio based on regulatory classifications, which focuses on the underlying loan collateral, and differs from
internal classifications presented herein that focus on the primary purpose of the loan.
48
Source: BB&T CORP, 10-K, February 25, 2016 Powered by Morningstar® Document Research℠
The information contained herein may not be copied, adapted or distributed and is not warranted to be accurate, complete or timely. The user assumes all risks for any damages or losses arising from any use of this information,
except to the extent such damages or losses cannot be limited or excluded by applicable law. Past financial performance is no guarantee of future results.