Philips 2015 Annual Report Download - page 106
Download and view the complete annual report
Please find page 106 of the 2015 Philips annual report below. You can navigate through the pages in the report by either clicking on the pages listed below, or by using the keyword search tool below to find specific information within the annual report.-
 1
1 -
2
-
3
-
4
-
5
-
6
-
7
-
8
-
9
-
10
-
11
-
12
-
13
-
14
-
15
-
16
-
17
-
18
-
19
-
20
-
21
-
22
-
23
-
24
-
25
-
26
-
27
-
28
-
29
-
30
-
31
-
32
-
33
-
34
-
35
-
36
-
37
-
38
-
39
-
40
-
41
-
42
-
43
-
44
-
45
-
46
-
47
-
48
-
49
-
50
-
51
-
52
-
53
-
54
-
55
-
56
-
57
-
58
-
59
-
60
-
61
-
62
-
63
-
64
-
65
-
66
-
67
-
68
-
69
-
70
-
71
-
72
-
73
-
74
-
75
-
76
-
77
-
78
-
79
-
80
-
81
-
82
-
83
-
84
-
85
-
86
-
87
-
88
-
89
-
90
-
91
-
92
-
93
-
94
-
95
-
 96
96 -
 97
97 -
 98
98 -
 99
99 -
 100
100 -
 101
101 -
 102
102 -
 103
103 -
 104
104 -
 105
105 -
 106
106 -
 107
107 -
 108
108 -
 109
109 -
 110
110 -
 111
111 -
 112
112 -
 113
113 -
 114
114 -
 115
115 -
 116
116 -
117
-
118
-
119
-
120
-
121
-
122
-
123
-
124
-
125
-
126
-
127
-
128
-
129
-
130
-
131
-
132
-
133
-
134
-
135
-
136
-
137
-
138
-
139
-
140
-
141
-
142
-
143
-
144
-
145
-
146
-
147
-
148
-
149
-
150
-
151
-
152
-
153
-
154
-
155
-
156
-
157
-
158
-
159
-
160
-
161
-
162
-
163
-
164
-
165
-
166
-
167
-
168
-
169
-
170
-
171
-
172
-
173
-
174
-
175
-
176
-
177
-
178
-
179
-
180
-
181
-
182
-
183
-
184
-
185
-
186
-
187
-
188
-
189
-
190
-
191
-
192
-
193
-
194
-
195
-
196
-
197
-
198
-
199
-
200
-
201
-
202
-
203
-
204
-
205
-
206
-
207
-
208
-
209
-
210
-
211
-
212
-
213
-
214
-
215
-
216
-
217
-
218
-
219
-
220
-
221
-
222
-
223
-
224
-
225
-
226
-
227
-
228
-
229
-
230
-
231
-
232
-
233
-
234
-
235
-
236
-
237
-
238
 |
 |
Group nancial statements 12.4
106 Annual Report 2015
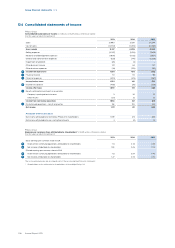
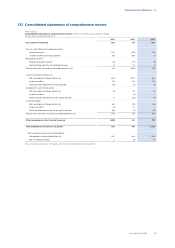
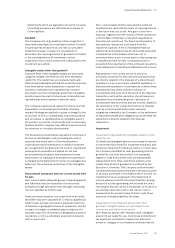
12.4 Consolidated statements of income
Philips Group
Consolidated statements of income in millions of EUR unless otherwise stated
For the years ended December 31
2013 2014 2015
Sales 21,990 21,391 24,244
Cost of sales (12,653) (13,185) (14,388)
Gross margin 9,337 8,206 9,856
Selling expenses (5,057) (5,124) (5,815)
Research and development expenses (1,659) (1,635) (1,927)
General and administrative expenses (825) (747) (1,209)
Impairment of goodwill (28) (3) -
Other business income 122 63 137
Other business expenses (35) (274) (50)
6Income from operations 1,855 486 992
7Financial income 70 114 98
7Financial expenses (400) (415) (467)
Income before taxes 1,525 185 623
8Income tax expense (466) (26) (239)
Income after taxes 1,059 159 384
5Results relating to investments in associates:
Company’s participation in income 5 30 10
Other results (30) 32 20
Income from continuing operations 1,034 221 414
3Discontinued operations - net of income tax 138 190 245
Net income 1,172 411 659
Attribution of net income (loss)
Net income attributable to Koninklijke Philips N.V. shareholders 1,169 415 645
Net income attributable to non-controlling interests 3 (4) 14
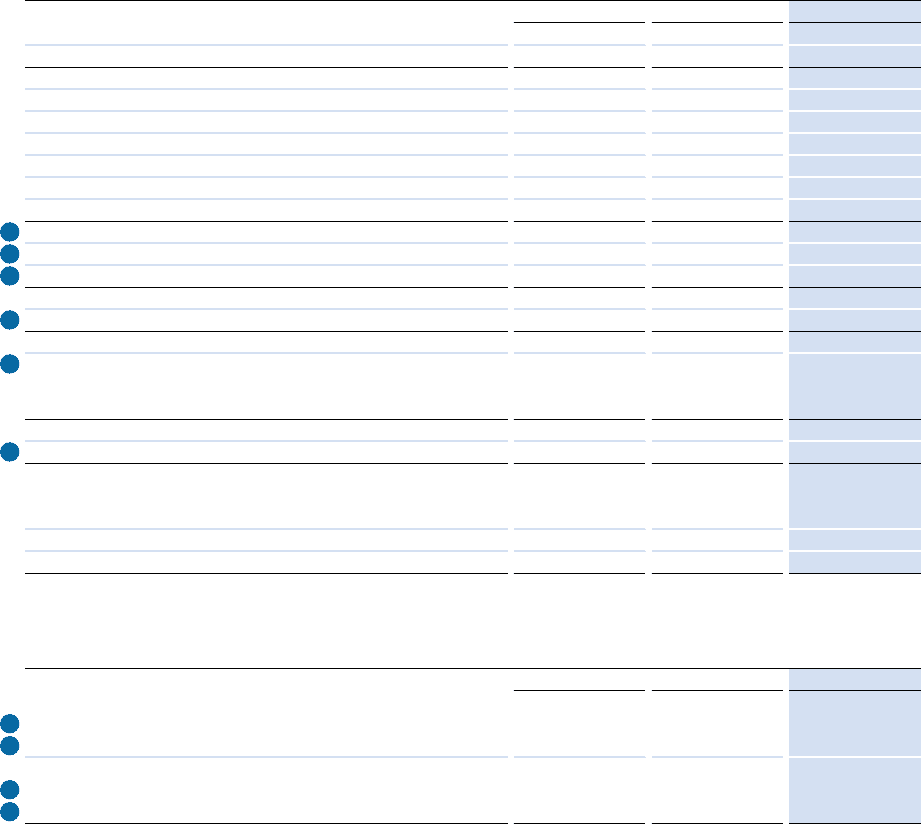
Philips Group
Earnings per common share attributable to shareholders1) in EUR unless otherwise stated
For the years ended December 31
2013 2014 2015
Basic earnings per common share in EUR
9Income from continuing operations attributable to shareholders 1.13 0.25 0.44
9Net income attributable to shareholders 1.28 0.45 0.70
Diluted earnings per common share in EUR
9Income from continuing operations attributable to shareholders 1.12 0.24 0.43
9Net income attributable to shareholders 1.27 0.45 0.70
The accompanying notes are an integral part of these consolidated nancial statements.
1) Shareholders in this table refer to shareholders of Koninklijke Philips N.V.