Philips 2015 Annual Report Download - page 206
Download and view the complete annual report
Please find page 206 of the 2015 Philips annual report below. You can navigate through the pages in the report by either clicking on the pages listed below, or by using the keyword search tool below to find specific information within the annual report.-
 1
1 -
2
-
3
-
4
-
5
-
6
-
7
-
8
-
9
-
10
-
11
-
12
-
13
-
14
-
15
-
16
-
17
-
18
-
19
-
20
-
21
-
22
-
23
-
24
-
25
-
26
-
27
-
28
-
29
-
30
-
31
-
32
-
33
-
34
-
35
-
36
-
37
-
38
-
39
-
40
-
41
-
42
-
43
-
44
-
45
-
46
-
47
-
48
-
49
-
50
-
51
-
52
-
53
-
54
-
55
-
56
-
57
-
58
-
59
-
60
-
61
-
62
-
63
-
64
-
65
-
66
-
67
-
68
-
69
-
70
-
71
-
72
-
73
-
74
-
75
-
76
-
77
-
78
-
79
-
80
-
81
-
82
-
83
-
84
-
85
-
86
-
87
-
88
-
89
-
90
-
91
-
92
-
93
-
94
-
95
-
96
-
97
-
98
-
99
-
100
-
101
-
102
-
103
-
104
-
105
-
106
-
107
-
108
-
109
-
110
-
111
-
112
-
113
-
114
-
115
-
116
-
117
-
118
-
119
-
120
-
121
-
122
-
123
-
124
-
125
-
126
-
127
-
128
-
129
-
130
-
131
-
132
-
133
-
134
-
135
-
136
-
137
-
138
-
139
-
140
-
141
-
142
-
143
-
144
-
145
-
146
-
147
-
148
-
149
-
150
-
151
-
152
-
153
-
154
-
155
-
156
-
157
-
158
-
159
-
160
-
161
-
162
-
163
-
164
-
165
-
166
-
167
-
168
-
169
-
170
-
171
-
172
-
173
-
174
-
175
-
176
-
177
-
178
-
179
-
180
-
181
-
182
-
183
-
184
-
185
-
186
-
187
-
188
-
189
-
190
-
191
-
192
-
193
-
194
-
195
-
 196
196 -
 197
197 -
 198
198 -
 199
199 -
 200
200 -
 201
201 -
 202
202 -
 203
203 -
 204
204 -
 205
205 -
 206
206 -
 207
207 -
 208
208 -
 209
209 -
 210
210 -
 211
211 -
 212
212 -
 213
213 -
 214
214 -
 215
215 -
 216
216 -
217
-
218
-
219
-
220
-
221
-
222
-
223
-
224
-
225
-
226
-
227
-
228
-
229
-
230
-
231
-
232
-
233
-
234
-
235
-
236
-
237
-
238
 |
 |
Sustainability statements 14.3.3
206 Annual Report 2015
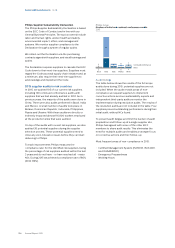
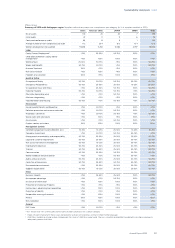
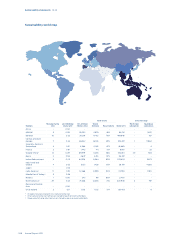
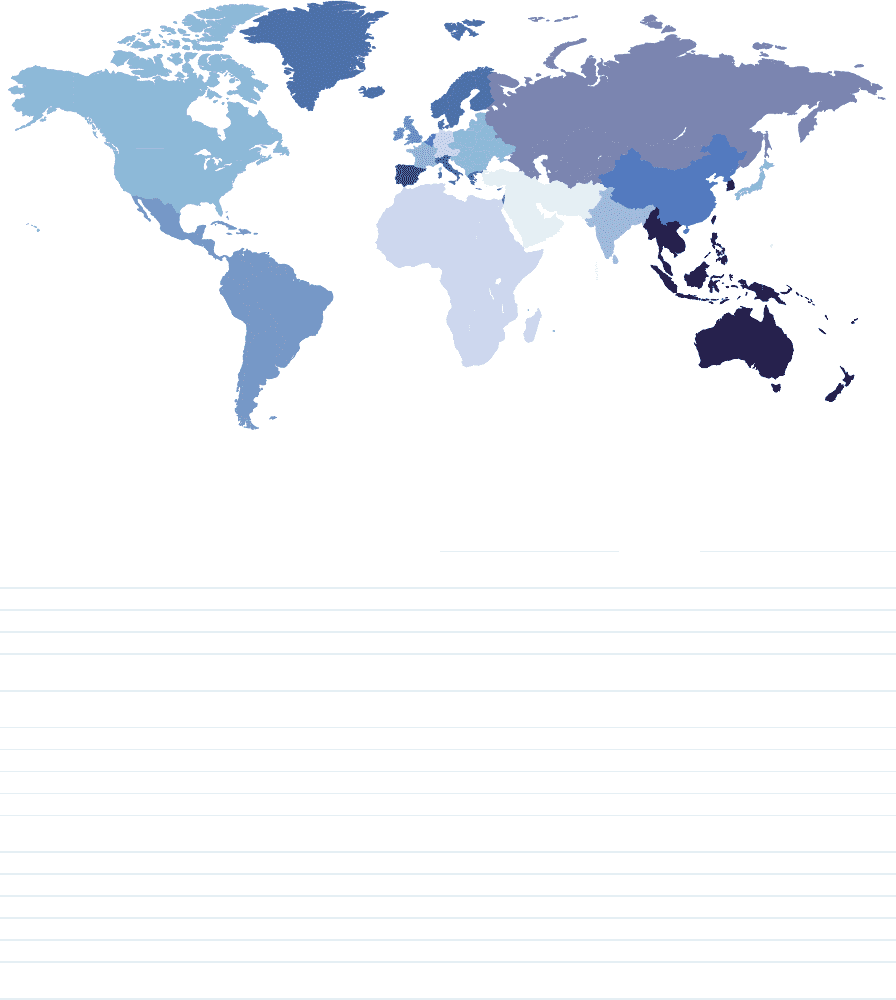
Sustainability world map
Total waste Emissions (kg)
Markets
Manufacturing
sites
Lost Workday
Injury rate1)
CO2 emitted
(Tonnes CO2)
Waste
(Tonnes) Recycled (%) Water (m3)
Restricted
substances
Hazardous
substances
Africa - 0.00 - - - - - -
ASEAN2) 3 0.09 29,252 2,979 46% 98,741 - 1,822
Benelux 10 0.22 20,219 9,472 79% 466,848 - 167
Central & Eastern
Europe 7 0.34 65,342 16,725 89% 374,427 1 11,962
Germany, Austria &
Switzerland 4 0.31 4,986 2,282 87% 48,669 - 4
France 2 0.81 1,443 411 72% 8,951 - 22
Greater China2) 12 0.09 89,979 5,203 86% 752,810 20 536
Iberia 2 0.94 4,647 4,415 97% 36,337 - -
Indian Subcontinent 5 0.03 64,208 5,964 99% 225,605 - 3,673
Italy, Israel and
Greece 4 0.52 5,123 1,428 65% 28,179 - 4,802
Japan - 0.16 - - - - - -
Latin America2) 11 0.19 12,468 5,999 90% 74,790 - 1,910
Middle East & Turkey3) 3 0.38 - - - - - -
Nordics 1 0.00 245 98 69% 2,400 - -
North America3) 29 0.23 71,646 12,303 73% 520,949 5 197
Russia and Central
Asia - 0.00 - - - - - -
UK & Ireland 2 0.11 1,051 1,135 77% 88,403 - 6
1) Includes manufacturing and non-manufacturing sites
2) One manufacturing site had not yet started to report environmental data
3) Three manufacturing sites had not yet started to report environmental data