Philips 2015 Annual Report Download - page 158
Download and view the complete annual report
Please find page 158 of the 2015 Philips annual report below. You can navigate through the pages in the report by either clicking on the pages listed below, or by using the keyword search tool below to find specific information within the annual report.-
 1
1 -
2
-
3
-
4
-
5
-
6
-
7
-
8
-
9
-
10
-
11
-
12
-
13
-
14
-
15
-
16
-
17
-
18
-
19
-
20
-
21
-
22
-
23
-
24
-
25
-
26
-
27
-
28
-
29
-
30
-
31
-
32
-
33
-
34
-
35
-
36
-
37
-
38
-
39
-
40
-
41
-
42
-
43
-
44
-
45
-
46
-
47
-
48
-
49
-
50
-
51
-
52
-
53
-
54
-
55
-
56
-
57
-
58
-
59
-
60
-
61
-
62
-
63
-
64
-
65
-
66
-
67
-
68
-
69
-
70
-
71
-
72
-
73
-
74
-
75
-
76
-
77
-
78
-
79
-
80
-
81
-
82
-
83
-
84
-
85
-
86
-
87
-
88
-
89
-
90
-
91
-
92
-
93
-
94
-
95
-
96
-
97
-
98
-
99
-
100
-
101
-
102
-
103
-
104
-
105
-
106
-
107
-
108
-
109
-
110
-
111
-
112
-
113
-
114
-
115
-
116
-
117
-
118
-
119
-
120
-
121
-
122
-
123
-
124
-
125
-
126
-
127
-
128
-
129
-
130
-
131
-
132
-
133
-
134
-
135
-
136
-
137
-
138
-
139
-
140
-
141
-
142
-
143
-
144
-
145
-
146
-
147
-
 148
148 -
 149
149 -
 150
150 -
 151
151 -
 152
152 -
 153
153 -
 154
154 -
 155
155 -
 156
156 -
 157
157 -
 158
158 -
 159
159 -
 160
160 -
 161
161 -
 162
162 -
 163
163 -
 164
164 -
 165
165 -
 166
166 -
 167
167 -
 168
168 -
169
-
170
-
171
-
172
-
173
-
174
-
175
-
176
-
177
-
178
-
179
-
180
-
181
-
182
-
183
-
184
-
185
-
186
-
187
-
188
-
189
-
190
-
191
-
192
-
193
-
194
-
195
-
196
-
197
-
198
-
199
-
200
-
201
-
202
-
203
-
204
-
205
-
206
-
207
-
208
-
209
-
210
-
211
-
212
-
213
-
214
-
215
-
216
-
217
-
218
-
219
-
220
-
221
-
222
-
223
-
224
-
225
-
226
-
227
-
228
-
229
-
230
-
231
-
232
-
233
-
234
-
235
-
236
-
237
-
238
 |
 |
Group nancial statements 12.9
158 Annual Report 2015
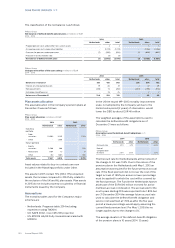
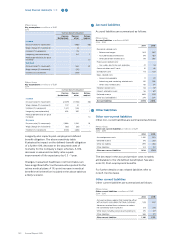
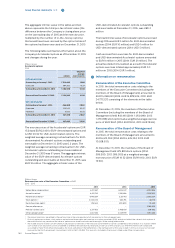
The fair value of the performance shares is measured
based on Monte-Carlo simulation, which takes into
account dividend payments between the grant date
and the vesting date by including reinvested dividends,
the market conditions expected to impact relative Total
Shareholders’ Return performance in relation to
selected peers, and the following weighted-average
assumptions:
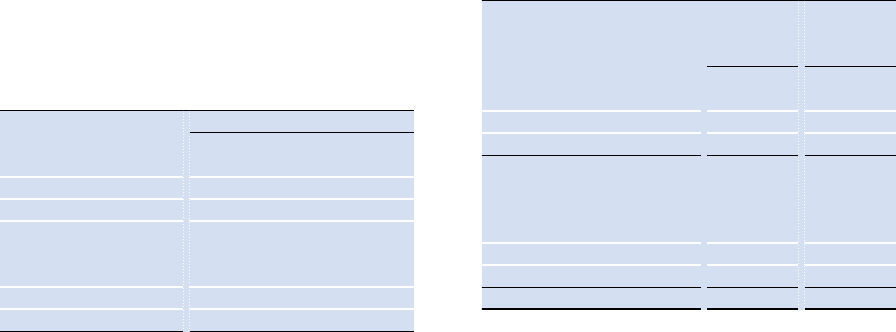
Philips Group
Assumptions used in Monte-Carlo simulation for valuation in %
2015
2015
EUR-denominated
Risk-free interest rate (0.11)%
Expected dividend yield 4.0%
Expected share price volatility 25%
USD-denominated
Risk-free interest rate (0.10)%
Expected dividend yield 4.0%
Expected share price volatility 27%
The assumptions were used for these calculations only
and do not necessarily represent an indication of
Management’s expectation of future developments for
other purposes. The Company has based its volatility
assumptions on historical experience measured over a
ten-year period.
The approach in calculating relative Total Shareholders
Return performance was determined to be based on
local currency instead of translating to the euro. This
clarication in the share-based compensation
arrangement did not result in accounting implications
for the grant of 2013 and 2014. For the grant of 2015 an
incremental fair value of EUR 6 million was recognized
in July and will be spread over the remaining vesting
period. The incremental fair value was measured using
the same assumptions used in the Monte-Carlo
simulation for the valuation of the 2015 grant, except for
the risk-free interest rate which was updated to (0.17)%.
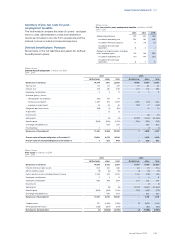
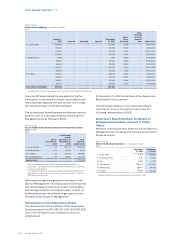
A summary of the status of the Company’s performance
share plans as of December 31, 2015 and changes
during the year are presented below:
Philips Group
Performance share plans
2015
shares1)
weighted
average
grant-date
fair value
EUR-denominated
Outstanding at January 1, 2015 6,304,002 22.92
Granted 3,067,530 28.54
Forfeited 976,550 24.18
Outstanding at December 31, 2015 8,394,982 24.83
USD-denominated
Outstanding at January 1, 2015 4,200,900 30.44
Granted 1,985,066 30.19
Forfeited 411,266 30.48
Outstanding at December 31, 2015 5,774,700 30.35
1) Excludes dividend declared on outstanding shares between grant date
and vesting date that will be issued in shares (EUR-denominated:
566,851 shares and USD-denominated: 395,970 shares)
At December 31, 2015, a total of EUR 157 million of
unrecognized compensation costs relate to non-vested
performance shares. These costs are expected to be
recognized over a weighted-average period of 1.8
years.
Restricted shares
The fair value of restricted shares is equal to the share
price at grant date less the present value, using the risk-
free interest rate, of estimated future dividends which
will not be received up to the vesting date.
The Company issues restricted shares that, in general,
vest in equal annual installments over a three-year
period, starting one year after the date of grant. For
grants up to and including January 2013 the Company
granted 20% additional (premium) shares, provided the
grantee still holds the shares after three years from the
delivery date and the grantee is still with the Company
on the respective delivery dates.