Philips 2015 Annual Report Download - page 142
Download and view the complete annual report
Please find page 142 of the 2015 Philips annual report below. You can navigate through the pages in the report by either clicking on the pages listed below, or by using the keyword search tool below to find specific information within the annual report.-
 1
1 -
2
-
3
-
4
-
5
-
6
-
7
-
8
-
9
-
10
-
11
-
12
-
13
-
14
-
15
-
16
-
17
-
18
-
19
-
20
-
21
-
22
-
23
-
24
-
25
-
26
-
27
-
28
-
29
-
30
-
31
-
32
-
33
-
34
-
35
-
36
-
37
-
38
-
39
-
40
-
41
-
42
-
43
-
44
-
45
-
46
-
47
-
48
-
49
-
50
-
51
-
52
-
53
-
54
-
55
-
56
-
57
-
58
-
59
-
60
-
61
-
62
-
63
-
64
-
65
-
66
-
67
-
68
-
69
-
70
-
71
-
72
-
73
-
74
-
75
-
76
-
77
-
78
-
79
-
80
-
81
-
82
-
83
-
84
-
85
-
86
-
87
-
88
-
89
-
90
-
91
-
92
-
93
-
94
-
95
-
96
-
97
-
98
-
99
-
100
-
101
-
102
-
103
-
104
-
105
-
106
-
107
-
108
-
109
-
110
-
111
-
112
-
113
-
114
-
115
-
116
-
117
-
118
-
119
-
120
-
121
-
122
-
123
-
124
-
125
-
126
-
127
-
128
-
129
-
130
-
131
-
 132
132 -
 133
133 -
 134
134 -
 135
135 -
 136
136 -
 137
137 -
 138
138 -
 139
139 -
 140
140 -
 141
141 -
 142
142 -
 143
143 -
 144
144 -
 145
145 -
 146
146 -
 147
147 -
 148
148 -
 149
149 -
 150
150 -
 151
151 -
 152
152 -
153
-
154
-
155
-
156
-
157
-
158
-
159
-
160
-
161
-
162
-
163
-
164
-
165
-
166
-
167
-
168
-
169
-
170
-
171
-
172
-
173
-
174
-
175
-
176
-
177
-
178
-
179
-
180
-
181
-
182
-
183
-
184
-
185
-
186
-
187
-
188
-
189
-
190
-
191
-
192
-
193
-
194
-
195
-
196
-
197
-
198
-
199
-
200
-
201
-
202
-
203
-
204
-
205
-
206
-
207
-
208
-
209
-
210
-
211
-
212
-
213
-
214
-
215
-
216
-
217
-
218
-
219
-
220
-
221
-
222
-
223
-
224
-
225
-
226
-
227
-
228
-
229
-
230
-
231
-
232
-
233
-
234
-
235
-
236
-
237
-
238
 |
 |
Group nancial statements 12.9
142 Annual Report 2015
available-for-sale nancial assets of EUR 56 million
and unrealized gains related to cash ow hedges of
EUR 12 million.
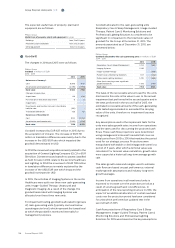
The legal reserve required by Dutch law of EUR 958
million included under retained earnings relates to any
legal or economic restrictions on the ability of aliated
companies to transfer funds to the parent company in
the form of dividends.
As at December 31, 2014, these limitations in
distributable amounts were EUR 1,515 million and
related to common shares of EUR 187 million, as well as
to legal reserves required by Dutch law included under
retained earnings of EUR 1,059 million, revaluation
reserves of EUR 13 million, available-for-sale nancial
assets of EUR 27 million and unrealized currency
translation gains EUR 229 million. The unrealized losses
related to cash ow hedges of EUR 13 million, although
qualifying as a legal reserve, reduce the distributable
amount by their nature.
Non-controlling interests
Non-controlling interests relate to minority stakes held
by third parties in consolidated group companies. The
Net income attributable to non-controlling interests
amounted to EUR 14 million in 2015 (Net loss
attributable to non-controlling interests 2014: EUR 4
million).
The non-controlling interests mainly relate to General
Lighting Company (GLC), in which Alliance Holding
domiciled in Kingdom of Saudi Arabia holds an
ownership percentage of 49%.
Objectives, policies and processes for
managing capital
Philips manages capital based upon the measures net
operating capital (NOC), net debt and cash ows before
nancing activities.
The Company believes that an understanding of the
Philips Group’s nancial condition is enhanced by the
disclosure of NOC, as this gure is used by Philips’
management to evaluate the capital eciency of the
Philips Group and its operating sectors. NOC is dened
as: total assets excluding assets classied as held for
sale less: (a) cash and cash equivalents, (b) deferred tax
assets, (c) other non-current nancial assets and
current nancial assets, (d) investments in associates,
and after deduction of: (e) long-term provisions and
short-term provisions, (f) accounts and notes payable,
(g) accrued liabilities, (h) income tax payable, (i) non-
current derivative nancial liabilities and derivative
nancial liabilities and (j) other non-current liabilities
and other current liabilities.
Net debt is dened as the sum of long- and short-term
debt minus cash and cash equivalents. The net debt
position as a percentage of the sum of group equity
(shareholders’ equity and non-controlling interests)
and net debt is presented to express the nancial
strength of the Company. This measure is widely used
by management and investment analysts and is
therefore included in the disclosure. Our net debt
position is managed in such a way that we expect to
retain a strong investment grade credit rating.
Furthermore, the Group’s aim when managing the net
debt position is dividend stability and a pay-out ratio
of 40% to 50% of continuing net income. Following the
intended separation of the Lighting business, the
dividend pay-out ratio with respect to future years
could be subject to change.
Cash ows before nancing activities, being the sum of
net cash from operating activities and net cash from
investing activities, are presented separately to
facilitate the reader’s understanding of the Company’s
funding requirements.
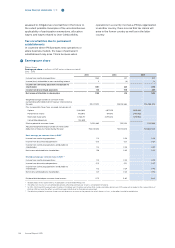
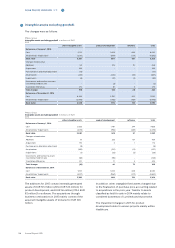
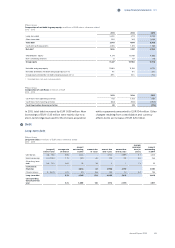
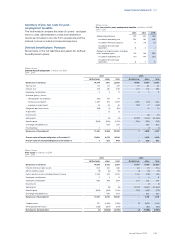
Philips Group
Net operating capital composition in millions of EUR
2013 - 2015
2013 2014 2015
Intangible assets 9,766 10,526 12,216
Property, plant and equipment 2,780 2,095 2,322
Remaining assets 8,699 9,041 9,423
Provisions (2,554) (3,445) (3,225)
Other liabilities (8,453) (9,379) (9,640)
Net operating capital 10,238 8,838 11,096