Philips 2015 Annual Report Download - page 44
Download and view the complete annual report
Please find page 44 of the 2015 Philips annual report below. You can navigate through the pages in the report by either clicking on the pages listed below, or by using the keyword search tool below to find specific information within the annual report.-
 1
1 -
2
-
3
-
4
-
5
-
6
-
7
-
8
-
9
-
10
-
11
-
12
-
13
-
14
-
15
-
16
-
17
-
18
-
19
-
20
-
21
-
22
-
23
-
24
-
25
-
26
-
27
-
28
-
29
-
30
-
31
-
32
-
33
-
 34
34 -
 35
35 -
 36
36 -
 37
37 -
 38
38 -
 39
39 -
 40
40 -
 41
41 -
 42
42 -
 43
43 -
 44
44 -
 45
45 -
 46
46 -
 47
47 -
 48
48 -
 49
49 -
 50
50 -
 51
51 -
 52
52 -
 53
53 -
 54
54 -
55
-
56
-
57
-
58
-
59
-
60
-
61
-
62
-
63
-
64
-
65
-
66
-
67
-
68
-
69
-
70
-
71
-
72
-
73
-
74
-
75
-
76
-
77
-
78
-
79
-
80
-
81
-
82
-
83
-
84
-
85
-
86
-
87
-
88
-
89
-
90
-
91
-
92
-
93
-
94
-
95
-
96
-
97
-
98
-
99
-
100
-
101
-
102
-
103
-
104
-
105
-
106
-
107
-
108
-
109
-
110
-
111
-
112
-
113
-
114
-
115
-
116
-
117
-
118
-
119
-
120
-
121
-
122
-
123
-
124
-
125
-
126
-
127
-
128
-
129
-
130
-
131
-
132
-
133
-
134
-
135
-
136
-
137
-
138
-
139
-
140
-
141
-
142
-
143
-
144
-
145
-
146
-
147
-
148
-
149
-
150
-
151
-
152
-
153
-
154
-
155
-
156
-
157
-
158
-
159
-
160
-
161
-
162
-
163
-
164
-
165
-
166
-
167
-
168
-
169
-
170
-
171
-
172
-
173
-
174
-
175
-
176
-
177
-
178
-
179
-
180
-
181
-
182
-
183
-
184
-
185
-
186
-
187
-
188
-
189
-
190
-
191
-
192
-
193
-
194
-
195
-
196
-
197
-
198
-
199
-
200
-
201
-
202
-
203
-
204
-
205
-
206
-
207
-
208
-
209
-
210
-
211
-
212
-
213
-
214
-
215
-
216
-
217
-
218
-
219
-
220
-
221
-
222
-
223
-
224
-
225
-
226
-
227
-
228
-
229
-
230
-
231
-
232
-
233
-
234
-
235
-
236
-
237
-
238
 |
 |
Group performance 5.3.3
44 Annual Report 2015
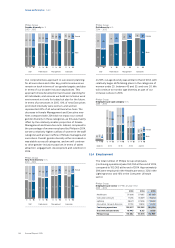
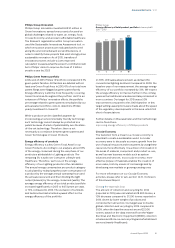
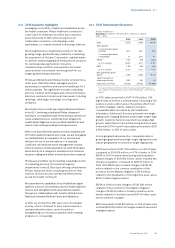
Water
Total water intake in 2015 was 2.7 million m3, about 12%
lower than in 2014. This decrease was mainly due to
lower production volumes at multiple Lighting sites
where water is used for cooling purposes, operational
changes and water-saving actions at various sites.
Lighting represents around 64% of total water usage. In
this sector, water is used in manufacturing as well as for
domestic purposes. The other sectors use water mainly
for domestic purposes. The exclusion of Lumileds and
Automotive has a signicant downward impact on the
water consumption of Philips. In 2015, Lumileds and
Automotive accounted for 1.7 million m3 of water.
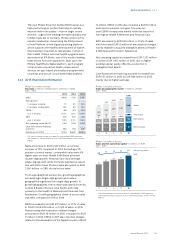
Philips Group
Water intake in thousands of m3
2011 - 2015
2011 2012 2013 2014 2015
Healthcare 308 421 454 514 439
Consumer
Lifestyle 338 303 586 537 537
Lighting 2,249 2,413 2,249 2,052 1,751
Innovation,
Group & Services - - - - -
Continuing
operations 2,895 3,137 3,289 3,103 2,727
Discontinued
operations 1,433 1,720 1,755 1,700 1,684
Philips Group 4,328 4,857 5,044 4,803 4,411
In 2015, 72% of water was purchased and 28% was
extracted from groundwater wells.
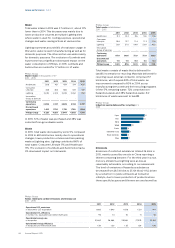
Waste
In 2015, total waste decreased by some 9% compared
to 2014 to 68.5 kilotonnes, mainly due to operational
changes, lower production volumes and less packing
waste at Lighting sites. Lighting contributed 66% of
total waste, Consumer Lifestyle 17% and Healthcare
17%. The exclusion of Lumileds and Automotive had a
9% downward impact on total waste.
Philips Group
Total waste in kilotonnes
2011 - 2015
2011 2012 2013 2014 2015
Healthcare 9.3 10.4 9.6 9.8 11.6
Consumer
Lifestyle 19.6 12.7 11.4 11.3 11.6
Lighting 58.1 57.5 54.9 53.9 45.3
Innovation,
Group & Services - - - - -
Continuing
operations 87.0 80.6 75.9 75.0 68.5
Discontinued
operations 7.0 7.0 16.1 5.4 6.4
Philips Group 94.0 87.6 92.0 80.4 74.9
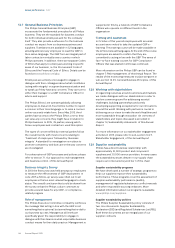
Total waste consists of waste that is delivered for
landll, incineration or recycling. Materials delivered for
recycling via an external contractor comprised 57
kilotonnes, which equals 83% of total waste, an
improvement compared to 80% in 2014, as our
manufacturing sites continued their recycling programs.
Of the 17% remaining waste, 72% comprised non-
hazardous waste and 28% hazardous waste; 8.2
kilotonnes of waste was sent to landll.
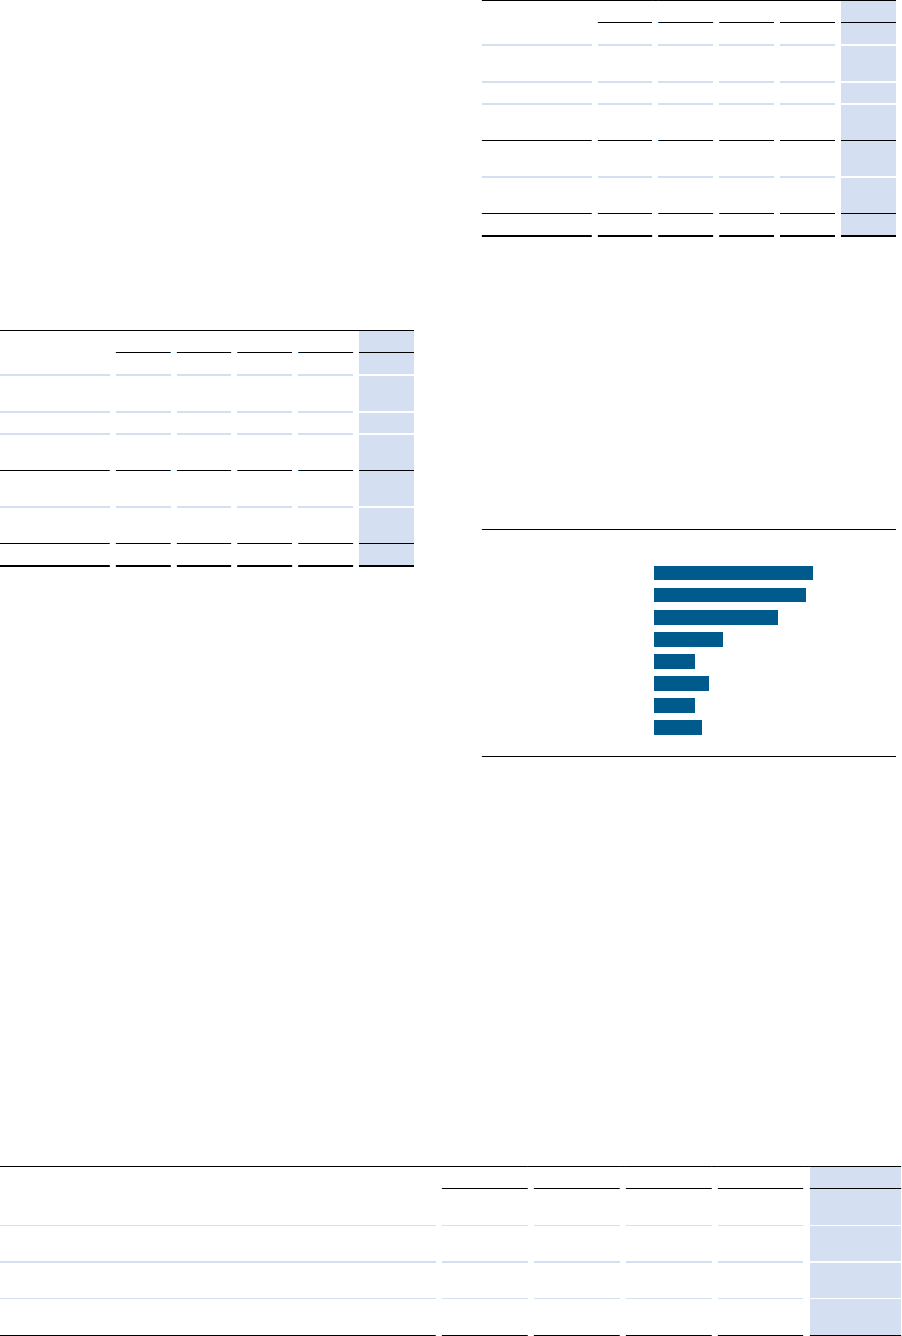
Philips Group
Industrial waste delivered for recycling in %
2015
23Paper
22Glass
18Metal
10Wood
6Plastic
8Demolition scrap
6Waste chemicals
7Other
Emissions
Emissions of restricted substances totaled 26 kilos in
2015, mainly caused by one site in China reporting a
thinner containing benzene. For the third year in a row,
mercury emissions at Lighting were as low as
reasonably achievable, according to our assessment.
The level of emissions of hazardous substances
decreased from 28,310 kilos to 25,101 kilos (-11%), driven
by a reduction in xylene emissions at Consumer
Lifestyle, due to lower production of products where
these specic lacquers and thinners are used as well as
Philips Group
Ratios relating to carbon emissions and energy use
2011 - 2015
2011 2012 2013 2014 2015
Operational CO2 emissions
in kilotonnes CO2-equivalent 1,892 1,640 1,678 1,521 1,417
Operational CO2 eciency
in tonnes CO2-equivalent per million EUR sales 95 74 76 71 58
Operational energy use
in terajoules 31,682 28,886 29,586 27,579 25,614
Operational energy eciency
in terajoules per million EUR sales 1.59 1.30 1.35 1.29 1.06