Philips 2015 Annual Report Download - page 36
Download and view the complete annual report
Please find page 36 of the 2015 Philips annual report below. You can navigate through the pages in the report by either clicking on the pages listed below, or by using the keyword search tool below to find specific information within the annual report.-
 1
1 -
2
-
3
-
4
-
5
-
6
-
7
-
8
-
9
-
10
-
11
-
12
-
13
-
14
-
15
-
16
-
17
-
18
-
19
-
20
-
21
-
22
-
23
-
24
-
25
-
 26
26 -
 27
27 -
 28
28 -
 29
29 -
 30
30 -
 31
31 -
 32
32 -
 33
33 -
 34
34 -
 35
35 -
 36
36 -
 37
37 -
 38
38 -
 39
39 -
 40
40 -
 41
41 -
 42
42 -
 43
43 -
 44
44 -
 45
45 -
 46
46 -
47
-
48
-
49
-
50
-
51
-
52
-
53
-
54
-
55
-
56
-
57
-
58
-
59
-
60
-
61
-
62
-
63
-
64
-
65
-
66
-
67
-
68
-
69
-
70
-
71
-
72
-
73
-
74
-
75
-
76
-
77
-
78
-
79
-
80
-
81
-
82
-
83
-
84
-
85
-
86
-
87
-
88
-
89
-
90
-
91
-
92
-
93
-
94
-
95
-
96
-
97
-
98
-
99
-
100
-
101
-
102
-
103
-
104
-
105
-
106
-
107
-
108
-
109
-
110
-
111
-
112
-
113
-
114
-
115
-
116
-
117
-
118
-
119
-
120
-
121
-
122
-
123
-
124
-
125
-
126
-
127
-
128
-
129
-
130
-
131
-
132
-
133
-
134
-
135
-
136
-
137
-
138
-
139
-
140
-
141
-
142
-
143
-
144
-
145
-
146
-
147
-
148
-
149
-
150
-
151
-
152
-
153
-
154
-
155
-
156
-
157
-
158
-
159
-
160
-
161
-
162
-
163
-
164
-
165
-
166
-
167
-
168
-
169
-
170
-
171
-
172
-
173
-
174
-
175
-
176
-
177
-
178
-
179
-
180
-
181
-
182
-
183
-
184
-
185
-
186
-
187
-
188
-
189
-
190
-
191
-
192
-
193
-
194
-
195
-
196
-
197
-
198
-
199
-
200
-
201
-
202
-
203
-
204
-
205
-
206
-
207
-
208
-
209
-
210
-
211
-
212
-
213
-
214
-
215
-
216
-
217
-
218
-
219
-
220
-
221
-
222
-
223
-
224
-
225
-
226
-
227
-
228
-
229
-
230
-
231
-
232
-
233
-
234
-
235
-
236
-
237
-
238
 |
 |
Group performance 5.2.3
36 Annual Report 2015
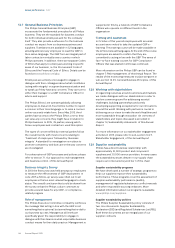
Philips Group
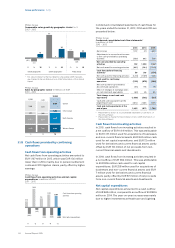
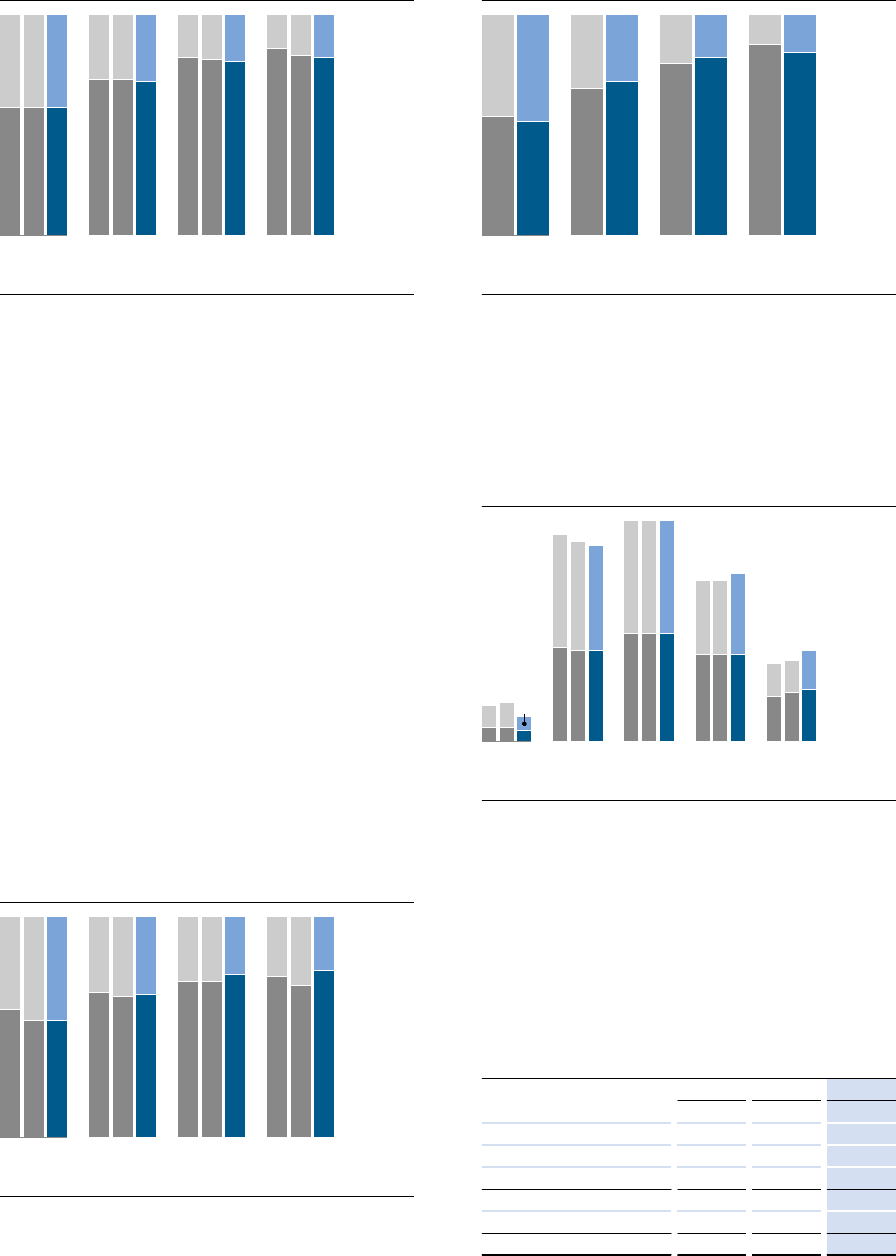
Gender diversity in %
2013 - 2015
58
42
‘13
58
42
‘14
58
42
‘15
Staff
71
29
‘13
71
29
‘14
70
30
‘15
Professionals
81
19
‘13
80
20
‘14
79
21
‘15
Management
85
15
‘13
82
18
‘14
81 Male
19 Female
‘15
Executives
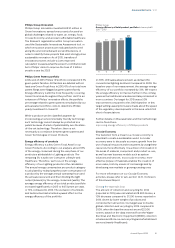
Our comprehensive approach to succession planning
for all executives and other key positions ensures we
remain on track in terms of our gender targets, and also
in terms of our broader inclusion aspirations. This
approach drives development and career planning for
all individuals, and ensures we build an inclusive work
environment not only for today but also for the future.
In terms of promotions in 2015, 10% of new Executives
promoted internally were women, and women
represented 24% of all external Executive hires. The
decrease in female Management and Executive new
hires compared with 2014 did not impact our overall
gender diversity in these categories, as this was mainly
oset by the relatively smaller proportion of female
Management and Executive exits. Indeed, compared to
the percentage of women employed by Philips in 2014,
we see a relatively higher outow of women in the sta
categories and a lower outow of female managers and
executives. Overall, gender diversity either increased or
was stable across all categories, and we will continue
to drive gender-inclusive practices in terms of talent
attraction, engagement, development and retention in
2016.
Philips Group
New hire diversity in %
2013 - 2015
58
42
‘13
53
47
‘14
53
47
‘15
Staff
66
34
‘13
64
36
‘14
65
35
‘15
Professionals
71
29
‘13
71
29
‘14
74
26
‘15
Management
73
27
‘13
69
31
‘14
76 Male
24 Female
‘15
Executives
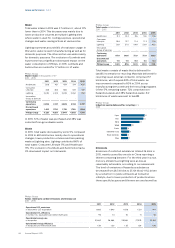
Philips Group
Exit diversity in %
2014 - 2015
54
46
‘14
52
48
‘15
Staff
67
33
‘14
70
30
‘15
Professionals
78
22
‘14
81
19
‘15
Management
87
13
‘14
83 Male
17 Female
‘15
Executives
In 2015, our age diversity was similar to that of 2014, with
relatively larger shifts taking place in the categories of
women under 25, between 45 and 55, and over 55. We
will continue to monitor age diversity as part of our
inclusive culture in 2016.
Philips Group
Employees per age category in %
2013 - 2015
4
6
‘13
4
7
‘14
3
4
‘15
under 25
27
32
‘13
26
31
‘14
26
30
‘15
25-35
31
32
‘13
31
32
‘14
31
32
‘15
35-45
25
21
‘13
25
21
‘14
25
23
‘15
45-55
13
9
‘13
14
9
‘14
15 Male
11 Female
‘15
over 55
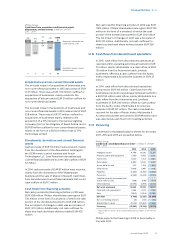
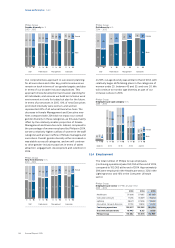
5.2.4 Employment
The total number of Philips Group employees
(continuing operations) was 104,204 at the end of 2015,
compared to 105,365 at the end of 2014. Approximately
38% were employed in the Healthcare sector, 32% in the
Lighting sector and 16% in the Consumer Lifestyle
sector.
Philips Group
Employees per sector in FTEs at year-end
2013 - 2015
2013 2014 2015
Healthcare 37,008 37,065 40,099
Consumer Lifestyle 17,255 16,639 16,254
Lighting 38,671 37,808 33,618
Innovation, Group & Services 12,703 13,853 14,233
Continuing operations 105,637 105,365 104,204
Discontinued operations 10,445 8,313 8,755
Philips Group 116,082 113,678 112,959