Philips 2015 Annual Report Download - page 164
Download and view the complete annual report
Please find page 164 of the 2015 Philips annual report below. You can navigate through the pages in the report by either clicking on the pages listed below, or by using the keyword search tool below to find specific information within the annual report.-
 1
1 -
2
-
3
-
4
-
5
-
6
-
7
-
8
-
9
-
10
-
11
-
12
-
13
-
14
-
15
-
16
-
17
-
18
-
19
-
20
-
21
-
22
-
23
-
24
-
25
-
26
-
27
-
28
-
29
-
30
-
31
-
32
-
33
-
34
-
35
-
36
-
37
-
38
-
39
-
40
-
41
-
42
-
43
-
44
-
45
-
46
-
47
-
48
-
49
-
50
-
51
-
52
-
53
-
54
-
55
-
56
-
57
-
58
-
59
-
60
-
61
-
62
-
63
-
64
-
65
-
66
-
67
-
68
-
69
-
70
-
71
-
72
-
73
-
74
-
75
-
76
-
77
-
78
-
79
-
80
-
81
-
82
-
83
-
84
-
85
-
86
-
87
-
88
-
89
-
90
-
91
-
92
-
93
-
94
-
95
-
96
-
97
-
98
-
99
-
100
-
101
-
102
-
103
-
104
-
105
-
106
-
107
-
108
-
109
-
110
-
111
-
112
-
113
-
114
-
115
-
116
-
117
-
118
-
119
-
120
-
121
-
122
-
123
-
124
-
125
-
126
-
127
-
128
-
129
-
130
-
131
-
132
-
133
-
134
-
135
-
136
-
137
-
138
-
139
-
140
-
141
-
142
-
143
-
144
-
145
-
146
-
147
-
148
-
149
-
150
-
151
-
152
-
153
-
 154
154 -
 155
155 -
 156
156 -
 157
157 -
 158
158 -
 159
159 -
 160
160 -
 161
161 -
 162
162 -
 163
163 -
 164
164 -
 165
165 -
 166
166 -
 167
167 -
 168
168 -
 169
169 -
 170
170 -
 171
171 -
 172
172 -
 173
173 -
 174
174 -
175
-
176
-
177
-
178
-
179
-
180
-
181
-
182
-
183
-
184
-
185
-
186
-
187
-
188
-
189
-
190
-
191
-
192
-
193
-
194
-
195
-
196
-
197
-
198
-
199
-
200
-
201
-
202
-
203
-
204
-
205
-
206
-
207
-
208
-
209
-
210
-
211
-
212
-
213
-
214
-
215
-
216
-
217
-
218
-
219
-
220
-
221
-
222
-
223
-
224
-
225
-
226
-
227
-
228
-
229
-
230
-
231
-
232
-
233
-
234
-
235
-
236
-
237
-
238
 |
 |

Group nancial statements 12.9
164 Annual Report 2015
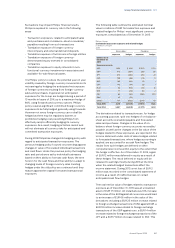
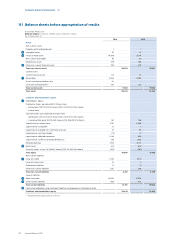
Philips Group
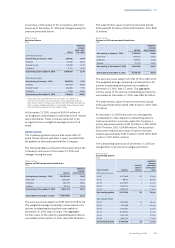
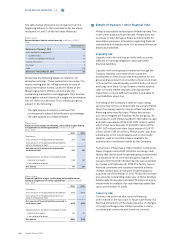
Fair value of nancial assets and liabilities in millions of EUR
2014 - 2015
Balance as of December 31, 2014 Balance as of December 31, 2015
carrying amount estimated fair value carrying amount estimated fair value
Financial assets
Carried at fair value:
Available-for-sale nancial assets - non-current 143 143 199 199
Securities classied as assets held for sale 38 38 (1) (1)
Fair value through prot and loss - non-current 24 24 33 33
Derivative nancial instruments 207 207 161 161
Financial assets carried at fair value 412 392
Carried at (amortized) cost:
Cash and cash equivalents 1,873 1,766
Loans and receivables:
Loans - current 125 125 12
Non-current loans and receivables 86 86 88 88
Other non-current loans and receivables 140 134
Loans classied as assets held for sale - 2
Receivables - current 4,723 4,982
Receivables - non-current 177 177 191 191
Held-to-maturity investments 2 2
Available-for-sale nancial assets 67 33
Financial assets carried at (amortized) costs 7,193 7,210
Financial liabilities
Carried at fair value:
Derivative nancial instruments (857) (857) (933) (933)
Financial liabilities carried at fair value (857) (933)
Carried at (amortized) cost:
Accounts payable (2,499) (2,673)
Interest accrual (56) (69)
Debt (Corporate bond and nance lease) (3,551) (4,164) (3,944) (4,294)
Debt (Bank loans, overdrafts etc.) (553) (1,816)
Financial liabilities carried at (amortized) costs (6,659) (8,502)