Philips 2015 Annual Report Download - page 49
Download and view the complete annual report
Please find page 49 of the 2015 Philips annual report below. You can navigate through the pages in the report by either clicking on the pages listed below, or by using the keyword search tool below to find specific information within the annual report.-
 1
1 -
2
-
3
-
4
-
5
-
6
-
7
-
8
-
9
-
10
-
11
-
12
-
13
-
14
-
15
-
16
-
17
-
18
-
19
-
20
-
21
-
22
-
23
-
24
-
25
-
26
-
27
-
28
-
29
-
30
-
31
-
32
-
33
-
34
-
35
-
36
-
37
-
38
-
 39
39 -
 40
40 -
 41
41 -
 42
42 -
 43
43 -
 44
44 -
 45
45 -
 46
46 -
 47
47 -
 48
48 -
 49
49 -
 50
50 -
 51
51 -
 52
52 -
 53
53 -
 54
54 -
 55
55 -
 56
56 -
 57
57 -
 58
58 -
 59
59 -
60
-
61
-
62
-
63
-
64
-
65
-
66
-
67
-
68
-
69
-
70
-
71
-
72
-
73
-
74
-
75
-
76
-
77
-
78
-
79
-
80
-
81
-
82
-
83
-
84
-
85
-
86
-
87
-
88
-
89
-
90
-
91
-
92
-
93
-
94
-
95
-
96
-
97
-
98
-
99
-
100
-
101
-
102
-
103
-
104
-
105
-
106
-
107
-
108
-
109
-
110
-
111
-
112
-
113
-
114
-
115
-
116
-
117
-
118
-
119
-
120
-
121
-
122
-
123
-
124
-
125
-
126
-
127
-
128
-
129
-
130
-
131
-
132
-
133
-
134
-
135
-
136
-
137
-
138
-
139
-
140
-
141
-
142
-
143
-
144
-
145
-
146
-
147
-
148
-
149
-
150
-
151
-
152
-
153
-
154
-
155
-
156
-
157
-
158
-
159
-
160
-
161
-
162
-
163
-
164
-
165
-
166
-
167
-
168
-
169
-
170
-
171
-
172
-
173
-
174
-
175
-
176
-
177
-
178
-
179
-
180
-
181
-
182
-
183
-
184
-
185
-
186
-
187
-
188
-
189
-
190
-
191
-
192
-
193
-
194
-
195
-
196
-
197
-
198
-
199
-
200
-
201
-
202
-
203
-
204
-
205
-
206
-
207
-
208
-
209
-
210
-
211
-
212
-
213
-
214
-
215
-
216
-
217
-
218
-
219
-
220
-
221
-
222
-
223
-
224
-
225
-
226
-
227
-
228
-
229
-
230
-
231
-
232
-
233
-
234
-
235
-
236
-
237
-
238
 |
 |

Sector performance 6.1.3
Annual Report 2015 49
6.1.3 2015 business highlights
Leveraging our portfolio, insights and capabilities across
the health continuum, Philips Healthcare continued to
create value for healthcare providers and consumers
around the world in 2015, with a strong focus on
collaborative innovation, including large-scale
partnerships, co-created solutions, and strategic alliances.
We strengthened our leadership position in the fast-
growing image-guided therapy market by completing
the acquisition of Volcano Corporation, a global leader
in catheter-based imaging and measurement solutions
for cardiovascular applications. Volcano’s
complementary portfolio and expertise will create
opportunities to accelerate revenue growth for our
image-guided therapy business.
Philips and Westchester Medical Center entered into a
multi-year, USD 500 million managed services
partnership to transform and improve healthcare for 3
million patients. The agreement includes consulting
services, medical technologies and clinical informatics
solutions, and aims to improve all care areas, including
radiology, cardiology, neurology, oncology and
pediatrics.
We introduced our Lumify app-based ultrasound solution
in the US. Combining a dedicated Philips ultrasound
transducer, a compatible smart device and app, and secure
cloud-enabled services, Lumify has been designed to
enable faster diagnosis, improve patient satisfaction and
reduce costs, while generating recurring revenues.
With more than 800,000 patient monitors installed and
275 million patients tracked every year, we are leveraging
our installed base for expansion of our services and
efficient roll-out of our innovations. For example,
CareEvent, an enterprise event management solution,
which includes a mobile application to send informative
alerts directly to a caregiver’s smartphone for informed
decision making and timely interventions when required.
Philips acquired Blue Jay Consulting, a leading provider
of consulting services to hospital emergency
departments in the US. Blue Jay’s oering complements
Philips’ enterprise-wide consulting services to help
improve clinical care and operational eectiveness
across the health continuum.
We expanded the capabilities of our HealthSuite digital
platform, a secure cloud infrastructure for health data and
devices, and strengthened the associated ecosystem
through our collaborations with Amazon Web Services,
Radboud University Medical Center and Salesforce.
In 2015, we entered the fth year of our Accelerate!
journey, which continued to drive improvements in
operational performance, as we focused on
strengthening our innovation pipeline while making
progress on cost savings.
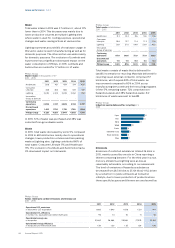
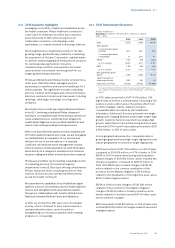
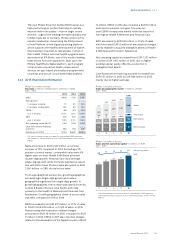
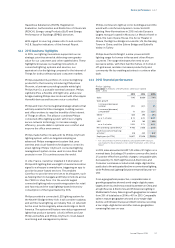
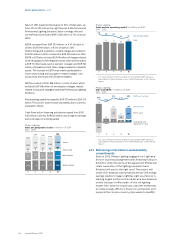
6.1.4 2015 nancial performance
Philips Healthcare
Key data in millions of EUR unless otherwise stated
2013 - 2015
2013 2014 2015
Sales 9,575 9,186 10,912
Sales growth
% increase (decrease),
nominal (4)% (4)% 19%
% increase (decrease),
comparable1) 1% (2)% 4%
EBITA 1) 1,512 616 1,024
as a % of sales 15.8% 6.7% 9.4%
EBIT 1,315 456 819
as a % of sales 13.7% 5.0% 7.5%
Net operating capital
(NOC)1) 7,437 7,565 9,212
Cash ows before
nancing activities1) 1,292 910 81
Employees (in FTEs) 37,008 37,065 40,099
1) For a reconciliation to the most directly comparable GAAP measures,
see chapter 15, Reconciliation of non-GAAP information, of this Annual
Report
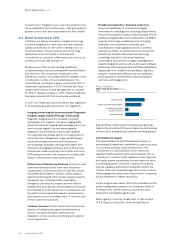
In 2015, sales amounted to EUR 10,912 million, 19%
higher than in 2014 on a nominal basis. Excluding a 12%
positive currency eect and a 3% positive eect from
portfolio changes, mainly related to Volcano,
comparable sales increased by 4%. Healthcare
Informatics, Solutions & Services achieved mid-single-
digit growth, Imaging Systems posted high-single-digit
growth, Customer Services reported low-single-digit
growth, while Patient Care & Monitoring Solutions was
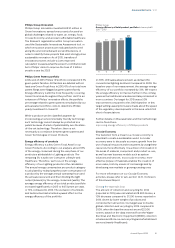
in line with 2014. Green Product sales amounted to EUR
4,580 million, or 42% of sector sales.
From a geographical perspective, comparable sales in
growth geographies showed high-single-digit growth, and
mature geographies recorded low-single-digit growth.
EBITA amounted to EUR 1,024 million, or 9.4% of sales,
compared to EUR 616 million, or 6.7% of sales, in 2014.
EBITA in 2015 included restructuring and acquisition-
related charges of EUR 168 million, which included the
Volcano acquisition, compared to EUR 70 million in
2014. 2015 EBITA also included charges of EUR 28
million related to the currency revaluation of the
provision for the Masimo litigation, EUR 8 million
related to the devaluation of the Argentine peso, and a
EUR 31 million legal provision.
EBITA in 2014 included charges of EUR 366 million
related to the provision for the Masimo litigation,
charges of EUR 49 million of mainly inventory write-
downs related to Cleveland and a EUR 16 million past-
service pension cost gain.
EBIT amounted to EUR 819 million, or 7.5% of sales, and
included EUR 205 million of charges related to acquired
intangible assets.