Philips 2015 Annual Report Download - page 136
Download and view the complete annual report
Please find page 136 of the 2015 Philips annual report below. You can navigate through the pages in the report by either clicking on the pages listed below, or by using the keyword search tool below to find specific information within the annual report.-
 1
1 -
2
-
3
-
4
-
5
-
6
-
7
-
8
-
9
-
10
-
11
-
12
-
13
-
14
-
15
-
16
-
17
-
18
-
19
-
20
-
21
-
22
-
23
-
24
-
25
-
26
-
27
-
28
-
29
-
30
-
31
-
32
-
33
-
34
-
35
-
36
-
37
-
38
-
39
-
40
-
41
-
42
-
43
-
44
-
45
-
46
-
47
-
48
-
49
-
50
-
51
-
52
-
53
-
54
-
55
-
56
-
57
-
58
-
59
-
60
-
61
-
62
-
63
-
64
-
65
-
66
-
67
-
68
-
69
-
70
-
71
-
72
-
73
-
74
-
75
-
76
-
77
-
78
-
79
-
80
-
81
-
82
-
83
-
84
-
85
-
86
-
87
-
88
-
89
-
90
-
91
-
92
-
93
-
94
-
95
-
96
-
97
-
98
-
99
-
100
-
101
-
102
-
103
-
104
-
105
-
106
-
107
-
108
-
109
-
110
-
111
-
112
-
113
-
114
-
115
-
116
-
117
-
118
-
119
-
120
-
121
-
122
-
123
-
124
-
125
-
 126
126 -
 127
127 -
 128
128 -
 129
129 -
 130
130 -
 131
131 -
 132
132 -
 133
133 -
 134
134 -
 135
135 -
 136
136 -
 137
137 -
 138
138 -
 139
139 -
 140
140 -
 141
141 -
 142
142 -
 143
143 -
 144
144 -
 145
145 -
 146
146 -
147
-
148
-
149
-
150
-
151
-
152
-
153
-
154
-
155
-
156
-
157
-
158
-
159
-
160
-
161
-
162
-
163
-
164
-
165
-
166
-
167
-
168
-
169
-
170
-
171
-
172
-
173
-
174
-
175
-
176
-
177
-
178
-
179
-
180
-
181
-
182
-
183
-
184
-
185
-
186
-
187
-
188
-
189
-
190
-
191
-
192
-
193
-
194
-
195
-
196
-
197
-
198
-
199
-
200
-
201
-
202
-
203
-
204
-
205
-
206
-
207
-
208
-
209
-
210
-
211
-
212
-
213
-
214
-
215
-
216
-
217
-
218
-
219
-
220
-
221
-
222
-
223
-
224
-
225
-
226
-
227
-
228
-
229
-
230
-
231
-
232
-
233
-
234
-
235
-
236
-
237
-
238
 |
 |

Group nancial statements 12.9 11
136 Annual Report 2015
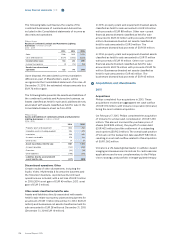
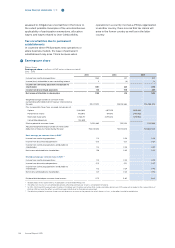
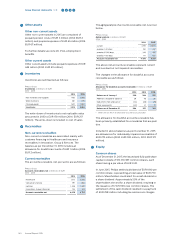
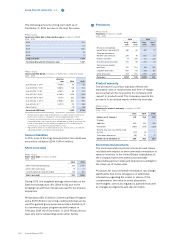
The expected useful lives of property, plant and
equipment are as follows:
Philips Group
Useful lives of property, plant and equipment in years
Buildings from 5 to 50 years
Machinery and installations from 3 to 20 years
Other equipment from 1 to 10 years
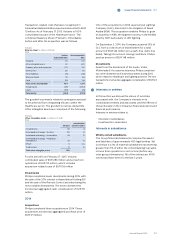
11 Goodwill
The changes in 2014 and 2015 were as follows:
Philips Group
Goodwill in millions of EUR
2014 - 2015
2014 2015
Balance as of January 1:
Cost 8,596 9,151
Amortization and impairments (2,092) (1,993)
Book value 6,504 7,158
Changes in book value:
Acquisitions 68 636
Purchase price allocation adjustment 8 8
Impairments - -
Divestments and transfers to assets classied as
held for sale (160) -
Translation dierences 738 721
Balance as of December 31:
Cost 9,151 10,704
Amortization and impairments (1,993) (2,181)
Book value 7,158 8,523
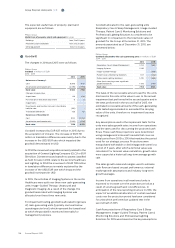
Goodwill increased by EUR 627 million in 2015 due to
the acquisition of Volcano. The increase of EUR 721
million in translation dierences was mainly due to the
increase in the USD/EUR rate which impacted the
goodwill denominated in USD.
In 2014 the movement acquisitions mainly related to the
acquisition of General Lighting Company (GLC) for EUR
58 million. Divestments and transfer to assets classied
as held for sale in 2014 relate to the sectors Healthcare
and Lighting. In 2014 the movement of EUR 738 million
in translation dierences is mainly explained by the
increase of the USD/EUR rate which impacted the
goodwill nominated in USD.
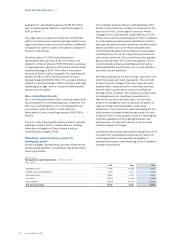
In 2015, the activities of Imaging Systems in the sector
Healthcare were split over three new cash-generating
units: Image-Guided Therapy, Ultrasound and
Diagnostic Imaging. As a result of the change, the
goodwill associated with Imaging Systems was
allocated over these three new units.
For impairment testing, goodwill is allocated to (groups
of) cash-generating units (typically one level below
operating sector level), which represent the lowest level
at which the goodwill is monitored internally for
management purposes.
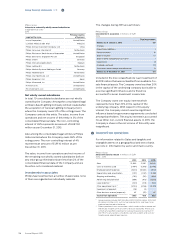
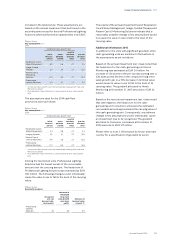
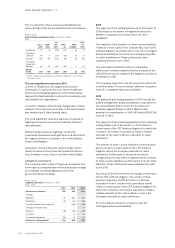
Goodwill allocated to the cash-generating units
Respiratory Care & Sleep Management, Image-Guided
Therapy, Patient Care & Monitoring Solutions and
Professional Lighting Solutions is considered to be
signicant in comparison to the total book value of
goodwill for the Group at December 31, 2015. The
amounts associated as of December 31, 2015, are
presented below:
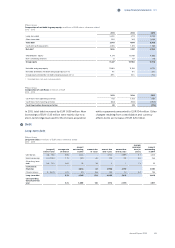
Philips Group
Goodwill allocated to the cash-generating units in millions of EUR
2014 - 2015
2014 2015
Respiratory Care & Sleep Management 1,704 1,884
Imaging Systems 1,592
Image-Guided Therapy 1,066
Patient Care & Monitoring Solutions 1,317 1,452
Professional Lighting Solutions 1,470 1,626
Other (units carrying a non-signicant
goodwill balance) 1,075 2,495
Book value 7,158 8,523
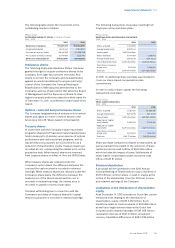
The basis of the recoverable amount used for the units
disclosed in this note is the value in use. In the annual
impairment test performed in the second quarter and in
the tests performed in the second half of 2015, the
estimated recoverable amounts of the cash-generating
units tested approximated or exceeded the carrying
value of the units, therefore no impairment loss was
recognized.
Key assumptions used in the impairment tests for the
units were sales growth rates, income from operations
and the rates used for discounting the projected cash
ows. These cash ow projections were determined
using management’s internal forecasts that cover an
initial period from 2015 to 2019 that matches the period
used for our strategic process. Projections were
extrapolated with stable or declining growth rates for a
period of 5 years, after which a terminal value was
calculated. For terminal value calculation, growth rates
were capped at a historical long-term average growth
rate.
The sales growth rates and margins used to estimate
cash ows are based on past performance, external
market growth assumptions and industry long-term
growth averages.
Income from operations in all mentioned units is
expected to increase over the projection period as a
result of volume growth and cost eciencies. In
anticipation of the new reporting structure in 2016, the
impact of an additional allocation of central overhead
costs over the projection period has been considered
for units which performed an updated test in the
second half of 2015.
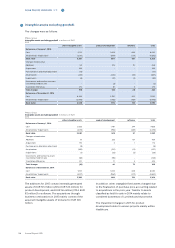
Cash ow projections of Respiratory Care & Sleep
Management, Image-Guided Therapy, Patient Care &
Monitoring Solutions and Professional Lighting
Solutions for 2015 were based on the key assumptions