Philips 2015 Annual Report Download - page 204
Download and view the complete annual report
Please find page 204 of the 2015 Philips annual report below. You can navigate through the pages in the report by either clicking on the pages listed below, or by using the keyword search tool below to find specific information within the annual report.-
 1
1 -
2
-
3
-
4
-
5
-
6
-
7
-
8
-
9
-
10
-
11
-
12
-
13
-
14
-
15
-
16
-
17
-
18
-
19
-
20
-
21
-
22
-
23
-
24
-
25
-
26
-
27
-
28
-
29
-
30
-
31
-
32
-
33
-
34
-
35
-
36
-
37
-
38
-
39
-
40
-
41
-
42
-
43
-
44
-
45
-
46
-
47
-
48
-
49
-
50
-
51
-
52
-
53
-
54
-
55
-
56
-
57
-
58
-
59
-
60
-
61
-
62
-
63
-
64
-
65
-
66
-
67
-
68
-
69
-
70
-
71
-
72
-
73
-
74
-
75
-
76
-
77
-
78
-
79
-
80
-
81
-
82
-
83
-
84
-
85
-
86
-
87
-
88
-
89
-
90
-
91
-
92
-
93
-
94
-
95
-
96
-
97
-
98
-
99
-
100
-
101
-
102
-
103
-
104
-
105
-
106
-
107
-
108
-
109
-
110
-
111
-
112
-
113
-
114
-
115
-
116
-
117
-
118
-
119
-
120
-
121
-
122
-
123
-
124
-
125
-
126
-
127
-
128
-
129
-
130
-
131
-
132
-
133
-
134
-
135
-
136
-
137
-
138
-
139
-
140
-
141
-
142
-
143
-
144
-
145
-
146
-
147
-
148
-
149
-
150
-
151
-
152
-
153
-
154
-
155
-
156
-
157
-
158
-
159
-
160
-
161
-
162
-
163
-
164
-
165
-
166
-
167
-
168
-
169
-
170
-
171
-
172
-
173
-
174
-
175
-
176
-
177
-
178
-
179
-
180
-
181
-
182
-
183
-
184
-
185
-
186
-
187
-
188
-
189
-
190
-
191
-
192
-
193
-
 194
194 -
 195
195 -
 196
196 -
 197
197 -
 198
198 -
 199
199 -
 200
200 -
 201
201 -
 202
202 -
 203
203 -
 204
204 -
 205
205 -
 206
206 -
 207
207 -
 208
208 -
 209
209 -
 210
210 -
 211
211 -
 212
212 -
 213
213 -
 214
214 -
215
-
216
-
217
-
218
-
219
-
220
-
221
-
222
-
223
-
224
-
225
-
226
-
227
-
228
-
229
-
230
-
231
-
232
-
233
-
234
-
235
-
236
-
237
-
238
 |
 |
Sustainability statements 14.3.3
204 Annual Report 2015
Philips Group
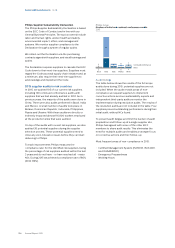
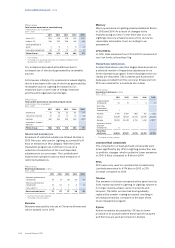
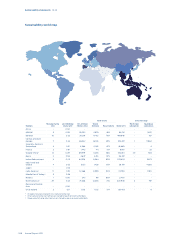
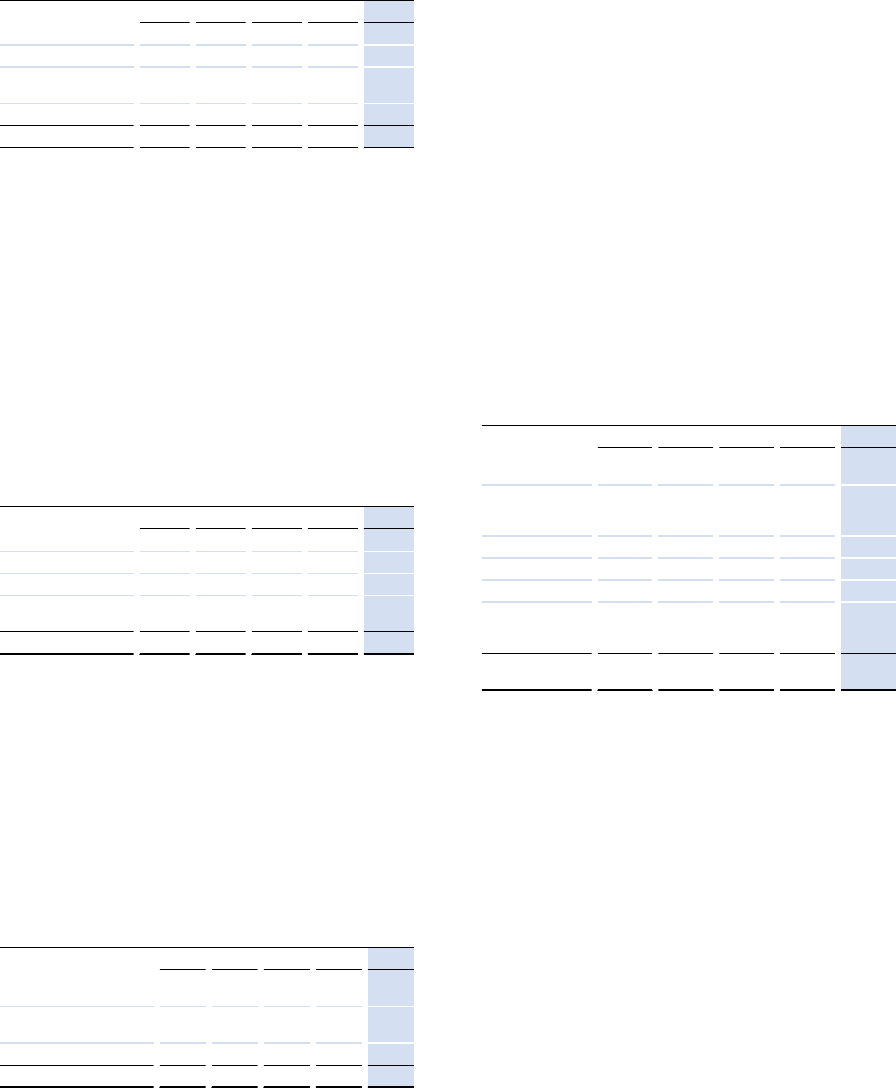
Total carbon emissions in manufacturing
in kilotonnes CO2-equivalent
2011 - 2015
2011 2012 2013 2014 2015
Direct CO2 1) 290 278 276 253 200
Indirect CO2238 252 208 185 148
Other greenhouse
gases 4 6 7 6 6
From glass production 28 27 27 24 17
Philips Group2) 560 563 518 468 371
1) From energy
2) Excluding non-reporting industrial sites therefore dierent from
Operational carbon footprint
CO2 emissions decreased at Healthcare due to
increased use of electricity generated by renewable
sources.
At Consumer Lifestyle, CO2 emissions increased slightly
due to a decrease in the use of electricity generated by
renewable sources. Lighting decreased its CO2
emissions due to lower load of energy-intensive
activities and organizational changes.
Philips Group
Total carbon emissions in manufacturing per sector
in kilotonnes CO2-equivalent
2011 - 2015
2011 2012 2013 2014 2015
Healthcare 57 78 57 50 47
Consumer Lifestyle 41 42 37 34 37
Lighting 462 443 424 384 287
Innovation, Group &
Services - - - - -
Philips Group 560 563 518 468 371
Restricted substances
Emissions of restricted substances totaled 26 kilos in
2015. Mercury, only used in Lighting, accounted for 8
kilos of emissions in this category. With the Green
Operations program we continue to focus on a
reduction of a selection of the most important
substances in our processes. The Lumileds and
Automotive operations did not have emissions of
restricted substances.
Philips Group
Restricted substances in kilos
2011 - 2015
2011 2012 2013 2014 2015
Benzene and benzene
compounds 55 121) 281) 201) 18
Mercury and mercury
compounds 51 54 8 8 8
CFCs/HCFCs2) 5 1 1 1 -
Restricted substances 111 67 37 29 26
1) Numbers have been restated
2) Excluding cooling systems
Benzene
Benzene was used by one site in China in a thinner and
will be phased out in 2016.
Mercury
Mercury emissions in Lighting remained stable at 8 kilos
in 2015 and 2014. As a result of changes in the
manufacturing process, for the third year in a row,
Lighting’s mercury emissions were at the ‘as low as
reasonably achievable’ level, according to our
assessment.
CFCs/HCFCs
In 2015, total emissions from CFCs/HCFCs remained at
very low levels, at less than 1 kg.
Hazardous substances
As described above, reduction targets have been set on
a selected number of hazardous substances in our
Green Operations program. In the following section our
results are described. The Lumileds and Automotive
data was excluded from the overview. Emissions from
PFCs are material for a Lumileds site in Asia.
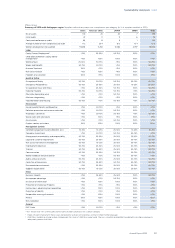
Philips Group
Hazardous substances in kilos
2011 - 2015
2011 2012 2013 2014 2015
Lead and lead
compounds 44 73 1 8 6
PFCs (Per
Fluorinated
Compounds)1) 1 - - - -
Toluene 5,745 6,184 1,188 162 163
Xylene 37,889 18,944 28,176 22,979 20,025
Styrene 19,920 42,329 5,753 5,161 4,907
Antimony, Arsenic
and their
compounds 5 - - - -
Hazardous
substances 63,604 67,530 35,118 28,310 25,101
1) Excluding cooling systems
Lead and lead compounds
The consumption of lead and lead compounds went
down signicantly (by 41%) in Lighting production due
to portfolio changes, which resulted in lower emissions
in 2015, 6 kilos compared to 8 kilos in 2014.
PFCs
PFCs were only used in Lumileds sites. Emissions by
Lumileds amounted to 4,174 kilos in 2015, a 23%
increase compared to 2014.
Toluene
The emission of toluene remained at the same level as
2014, mainly reported in Lighting. In Lighting, toluene is
no longer used as a basic carrier in solvents and
lacquers. The latter process has been gradually
replaced by powder coating processes, resulting in
decreased emissions compared to the start of the
Green Operations program.
Xylene
Xylene emissions decreased by 13% due to lower
production of products where these specic lacquers
and thinners are used at Consumer Lifestyle.