Philips 2015 Annual Report Download - page 86
Download and view the complete annual report
Please find page 86 of the 2015 Philips annual report below. You can navigate through the pages in the report by either clicking on the pages listed below, or by using the keyword search tool below to find specific information within the annual report.-
 1
1 -
2
-
3
-
4
-
5
-
6
-
7
-
8
-
9
-
10
-
11
-
12
-
13
-
14
-
15
-
16
-
17
-
18
-
19
-
20
-
21
-
22
-
23
-
24
-
25
-
26
-
27
-
28
-
29
-
30
-
31
-
32
-
33
-
34
-
35
-
36
-
37
-
38
-
39
-
40
-
41
-
42
-
43
-
44
-
45
-
46
-
47
-
48
-
49
-
50
-
51
-
52
-
53
-
54
-
55
-
56
-
57
-
58
-
59
-
60
-
61
-
62
-
63
-
64
-
65
-
66
-
67
-
68
-
69
-
70
-
71
-
72
-
73
-
74
-
75
-
 76
76 -
 77
77 -
 78
78 -
 79
79 -
 80
80 -
 81
81 -
 82
82 -
 83
83 -
 84
84 -
 85
85 -
 86
86 -
 87
87 -
 88
88 -
 89
89 -
 90
90 -
 91
91 -
 92
92 -
 93
93 -
 94
94 -
 95
95 -
 96
96 -
97
-
98
-
99
-
100
-
101
-
102
-
103
-
104
-
105
-
106
-
107
-
108
-
109
-
110
-
111
-
112
-
113
-
114
-
115
-
116
-
117
-
118
-
119
-
120
-
121
-
122
-
123
-
124
-
125
-
126
-
127
-
128
-
129
-
130
-
131
-
132
-
133
-
134
-
135
-
136
-
137
-
138
-
139
-
140
-
141
-
142
-
143
-
144
-
145
-
146
-
147
-
148
-
149
-
150
-
151
-
152
-
153
-
154
-
155
-
156
-
157
-
158
-
159
-
160
-
161
-
162
-
163
-
164
-
165
-
166
-
167
-
168
-
169
-
170
-
171
-
172
-
173
-
174
-
175
-
176
-
177
-
178
-
179
-
180
-
181
-
182
-
183
-
184
-
185
-
186
-
187
-
188
-
189
-
190
-
191
-
192
-
193
-
194
-
195
-
196
-
197
-
198
-
199
-
200
-
201
-
202
-
203
-
204
-
205
-
206
-
207
-
208
-
209
-
210
-
211
-
212
-
213
-
214
-
215
-
216
-
217
-
218
-
219
-
220
-
221
-
222
-
223
-
224
-
225
-
226
-
227
-
228
-
229
-
230
-
231
-
232
-
233
-
234
-
235
-
236
-
237
-
238
 |
 |
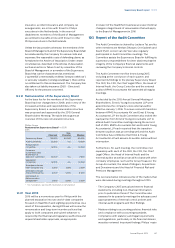
Supervisory Board report 10.2.7
86 Annual Report 2015
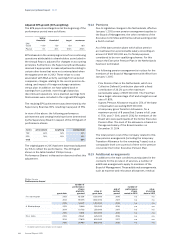
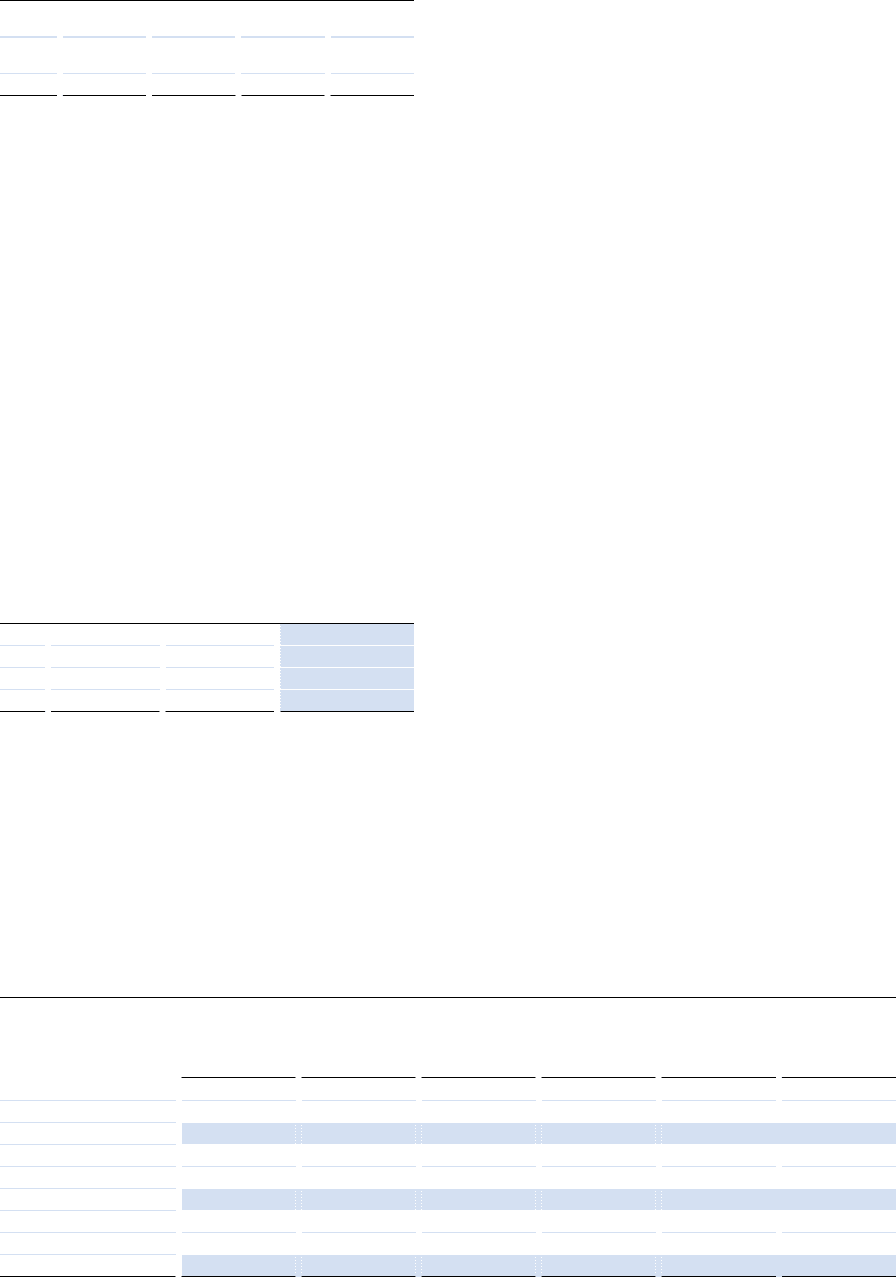
Adjusted EPS growth (50% weighting)
The EPS payouts and targets set at the beginning of the
performance period were as follows:
below
threshold threshold target maximum
EPS
(euro) <1.30 1.30 1.50 1.80
Payout 0% 40% 100% 200%
EPS is based on the underlying income from continuing
operations attributable to shareholders, as included in
the Annual Report, adjusted for changes in accounting
principles. Furthermore, the Supervisory Board has also
deemed it appropriate to make adjustments relating to
certain other items that were not contemplated when
the targets were set in 2012. These relate to costs
associated with M&A activity, earnings from acquired
companies, charges relating to the recent pension de-
risking, and impact of foreign exchange variations
versus plan. In addition, we have added back in
earnings from Lumileds, even though classed as
discontinued operations, since planned earnings from
this business were included in the original EPS targets.
The resulting EPS achievement was determined by the
Supervisory Board as 110%, resulting in a payout of 55%.
In view of the above, the following performance
achievement and vesting levels have been determined
by the Supervisory Board in respect of the 2013 grant of
performance shares:
metric achievement weighting vesting level
TSR 60% 50% 30%
EPS 110% 50% 55%
total 85%
The original grant in 2013 has been downward adjusted
by 15% to reect the performance. The 2013 grant
shown in the table headed ‘Philips Group -
Performance Shares’ in this section does not reect this
adjustment.
10.2.8 Pensions
Due to legislative changes in the Netherlands, eective
January 1, 2015 a new pension arrangement applies to
the Board of Management, the other members of the
Executive Committee and the Executives working under
a Dutch contract.
As of this date pension plans which allow pension
accrual based on a pensionable salary exceeding an
amount of EUR 100,000 are, for scal purposes,
considered to be non-qualifying schemes. For this
reason the Executive Pension Plan in the Netherlands
has been terminated.
The following pension arrangement is in place for the
members of the Board of Management with eect from
January 1, 2015:
• Flex Pension Plan in the Netherlands, which is a
Collective Dened Contribution plan with a xed
contribution of 26.2% up to the maximum
pensionable salary of EUR 100,000. The Flex Plan
has a target retirement age of 67 and a target accrual
rate of 1.85%;
•A gross Pension Allowance equal to 25% of the base
compensation exceeding EUR 100,000;
• A temporary gross Transition Allowance, for a
maximum period of 8 years (rst 5 years in full; year
6: 75%; year 7: 50%, year 8: 25%) for members of the
Board who were participants of the former Executive
Pension Plan. The level of the allowance is based on
the age and salary of the Board member on
December 31, 2014.
The total pension cost of the Company related to this
new pension arrangement (including the temporary
Transition Allowance for the remaining 7 years) is at a
comparable level over a period of time to the pension
cost under the former Executive Pension Plan.
10.2.9 Additional arrangements
In addition to the main conditions as stipulated in the
contracts for the provision of services, a number of
additional arrangements apply to members of the
Board of Management. These additional arrangements,
such as expense and relocation allowances, medical
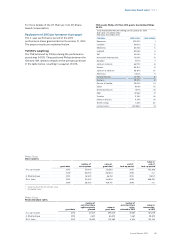
Philips Group
Performance shares1)
grant date
number of
performance
shares
originally
granted
value at
grant date
end of
vesting
period
number of
performance
shares
vested in 2015
value
at vesting
date in 2015
F.A. van Houten 2013 62,559 1,320,000 2016 n.a. n.a.
2014 59,075 1,380,000 2017 n.a. n.a.
2015 54,877 1,410,000 2018 n.a. n.a.
A. Bhattacharya 2013 11,848 250,000 2016 n.a. n.a.
2014 10,702 250,000 2017 n.a. n.a.
2015 11,676 300,000 2018 n.a. n.a.
P.A.J. Nota 2013 29,621 625,000 2016 n.a. n.a.
2014 27,825 650,000 2017 n.a. n.a.
2015 26,465 680,000 2018 n.a. n.a.
1) Dividend performance shares not included