Philips 2015 Annual Report Download - page 202
Download and view the complete annual report
Please find page 202 of the 2015 Philips annual report below. You can navigate through the pages in the report by either clicking on the pages listed below, or by using the keyword search tool below to find specific information within the annual report.-
 1
1 -
2
-
3
-
4
-
5
-
6
-
7
-
8
-
9
-
10
-
11
-
12
-
13
-
14
-
15
-
16
-
17
-
18
-
19
-
20
-
21
-
22
-
23
-
24
-
25
-
26
-
27
-
28
-
29
-
30
-
31
-
32
-
33
-
34
-
35
-
36
-
37
-
38
-
39
-
40
-
41
-
42
-
43
-
44
-
45
-
46
-
47
-
48
-
49
-
50
-
51
-
52
-
53
-
54
-
55
-
56
-
57
-
58
-
59
-
60
-
61
-
62
-
63
-
64
-
65
-
66
-
67
-
68
-
69
-
70
-
71
-
72
-
73
-
74
-
75
-
76
-
77
-
78
-
79
-
80
-
81
-
82
-
83
-
84
-
85
-
86
-
87
-
88
-
89
-
90
-
91
-
92
-
93
-
94
-
95
-
96
-
97
-
98
-
99
-
100
-
101
-
102
-
103
-
104
-
105
-
106
-
107
-
108
-
109
-
110
-
111
-
112
-
113
-
114
-
115
-
116
-
117
-
118
-
119
-
120
-
121
-
122
-
123
-
124
-
125
-
126
-
127
-
128
-
129
-
130
-
131
-
132
-
133
-
134
-
135
-
136
-
137
-
138
-
139
-
140
-
141
-
142
-
143
-
144
-
145
-
146
-
147
-
148
-
149
-
150
-
151
-
152
-
153
-
154
-
155
-
156
-
157
-
158
-
159
-
160
-
161
-
162
-
163
-
164
-
165
-
166
-
167
-
168
-
169
-
170
-
171
-
172
-
173
-
174
-
175
-
176
-
177
-
178
-
179
-
180
-
181
-
182
-
183
-
184
-
185
-
186
-
187
-
188
-
189
-
190
-
191
-
 192
192 -
 193
193 -
 194
194 -
 195
195 -
 196
196 -
 197
197 -
 198
198 -
 199
199 -
 200
200 -
 201
201 -
 202
202 -
 203
203 -
 204
204 -
 205
205 -
 206
206 -
 207
207 -
 208
208 -
 209
209 -
 210
210 -
 211
211 -
 212
212 -
213
-
214
-
215
-
216
-
217
-
218
-
219
-
220
-
221
-
222
-
223
-
224
-
225
-
226
-
227
-
228
-
229
-
230
-
231
-
232
-
233
-
234
-
235
-
236
-
237
-
238
 |
 |

Sustainability statements 14.3.1
202 Annual Report 2015
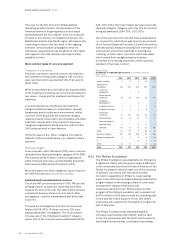
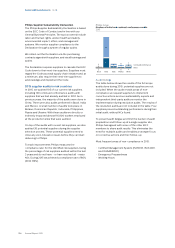
2015, driven by our Healthcare sector. Additionally, our
well-being products that help people live a healthy life,
and our Green Products that contribute to a healthy
ecosystem, improved the lives of 304 million and 1.7
billion people respectively. After the elimination of
double counts - people touched multiple times - we
arrived at 2.0 billion lives. This is an increase of around
140 million compared to 2014.
Examples of products in the ‘well-being’ category that
help people live a healthier life are air puriers, juicers,
blenders, air fryers, but also mother and childcare
products. Examples of Green Products, products
oering a signicant environmental improvement in
one or more Green Focal Areas, can be found in sub-
section 5.3.2, Green Product sales, of this Annual
Report. Further details on this parameter and the
methodology can be found in the document ‘Improving
people’s lives’.
The circular economy program
The circular economy program at Philips ran for the
third year in 2015 and consists of four strategic pillars:
1. Connect to stakeholders outside Philips
2. Internal employee engagement
3. Create proof points and metrics
4. Embed circular economy in Philips processes
Philips leverages the global partnership with the Ellen
MacArthur Foundation, which includes the CE100
events and education. But partnerships with Circle
Economy Netherlands, Turntoo, World Economic
Forum, US Chamber of Commerce Foundation and The
Guardian also help Philips to take a leading position in
driving circular thinking. For example, Philips opened
the doors of its refurbishment facilities in Bothell, USA
and hosted a Business Delegation Tour, co-organized
by Ecova and the US Chamber of Commerce
Foundation, showcasing to a growing number of
interested North-American businesses how the circular
economy looks like in action.
Through internal events, presentations, brochures,
internal communications, social media, etc. Philips’
employees are inspired and stimulated to start or
become involved in circular economy projects. For
example, new circular design criteria for luminaires
were road-tested by Philips engineers at multiple sites,
creating the basis for a new range of modular lighting
products to be developed in the coming years.
In many Philips business groups circular economy
projects have started. These are either linked to
customer access over ownership (pay for performance),
business model innovations (from transactions to
relationships via service and solution models) or
reverse cycles (remanufacturing, refurbishment and
parts harvesting). To measure progress, a circular
economy scorecard has been developed. As the
circular economy touches many dierent business
areas (strategy, design, business development,
marketing, nance, etc.) it is important to have the right
processes and procedures developed and embedded
throughout the company. This is done as part of the
development of the Philips Excellence Process
Framework.
More information can be found on the
circular economy website.
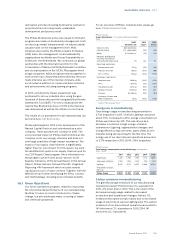
Operational carbon footprint and energy
eciency - 2015 details
This year we have achieved our 2015 EcoVision
reduction target that was set at a 40% decrease in CO2
reductions compared to our 2007 base year. Our carbon
footprint decreased by 7% compared to 2014, resulting
in a total of 1,417 kilotonnes CO2, a 41% decrease
compared to 2007. The 2015 results can be attributed
to several factors:
• Accounting for 28% of the total footprint, total CO2
emissions from manufacturing decreased by 17% due
to operational changes resulting in decreased energy
usage and a lower load; additionally the share
coming from renewable sources increased.
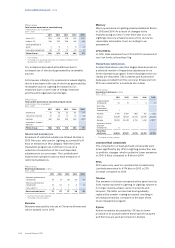
• CO2 emissions from non-industrial operations
(oces, warehouses, etc.) represent 7% of the total.
This year the overall oor space in our non-industrial
real estate portfolio decreased by 6%. Combined
with increased renewable energy usage, emissions
decreased by 16% compared to 2014. In 2016, we will
continue to focus on the most ecient use of facility
space and increase the share of purchased electricity
from renewable sources.
• The total CO2 emissions related to business travel,
accounting for 14% of our carbon footprint, showed a
slight decrease of 1% compared to 2014. The 2%
reductions achieved within business ights mitigated
the increase of 7% in our rental car emissions.
• Overall CO2 emissions from logistics, representing
51% of the total, showed a slight decrease of 0.3%
compared to 2014. We recorded an increase in
emissions from air and parcel freight. However,
reduced emissions from road and ocean freight
resulted in a downward change for logistics as a
whole.
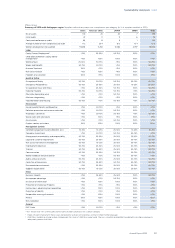
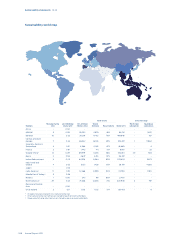
Philips Group
Operational carbon footprint for logistics
in kilotonnes CO2-equivalent
2011 - 2015
2011 2012 2013 2014 2015
Air transport 389 366 385 348 429
Road transport 275 169 174 164 118
Ocean transport 239 210 227 208 171
Philips Group 903 745 786 720 718
14.3.2 Biodiversity
Philips recognizes the importance of healthy
ecosystems and rich biodiversity for our company, our
employees, and society as a whole. We aim to minimize
any negative impacts and actively promote ecosystem