Philips 2015 Annual Report Download - page 191
Download and view the complete annual report
Please find page 191 of the 2015 Philips annual report below. You can navigate through the pages in the report by either clicking on the pages listed below, or by using the keyword search tool below to find specific information within the annual report.-
 1
1 -
2
-
3
-
4
-
5
-
6
-
7
-
8
-
9
-
10
-
11
-
12
-
13
-
14
-
15
-
16
-
17
-
18
-
19
-
20
-
21
-
22
-
23
-
24
-
25
-
26
-
27
-
28
-
29
-
30
-
31
-
32
-
33
-
34
-
35
-
36
-
37
-
38
-
39
-
40
-
41
-
42
-
43
-
44
-
45
-
46
-
47
-
48
-
49
-
50
-
51
-
52
-
53
-
54
-
55
-
56
-
57
-
58
-
59
-
60
-
61
-
62
-
63
-
64
-
65
-
66
-
67
-
68
-
69
-
70
-
71
-
72
-
73
-
74
-
75
-
76
-
77
-
78
-
79
-
80
-
81
-
82
-
83
-
84
-
85
-
86
-
87
-
88
-
89
-
90
-
91
-
92
-
93
-
94
-
95
-
96
-
97
-
98
-
99
-
100
-
101
-
102
-
103
-
104
-
105
-
106
-
107
-
108
-
109
-
110
-
111
-
112
-
113
-
114
-
115
-
116
-
117
-
118
-
119
-
120
-
121
-
122
-
123
-
124
-
125
-
126
-
127
-
128
-
129
-
130
-
131
-
132
-
133
-
134
-
135
-
136
-
137
-
138
-
139
-
140
-
141
-
142
-
143
-
144
-
145
-
146
-
147
-
148
-
149
-
150
-
151
-
152
-
153
-
154
-
155
-
156
-
157
-
158
-
159
-
160
-
161
-
162
-
163
-
164
-
165
-
166
-
167
-
168
-
169
-
170
-
171
-
172
-
173
-
174
-
175
-
176
-
177
-
178
-
179
-
180
-
 181
181 -
 182
182 -
 183
183 -
 184
184 -
 185
185 -
 186
186 -
 187
187 -
 188
188 -
 189
189 -
 190
190 -
 191
191 -
 192
192 -
 193
193 -
 194
194 -
 195
195 -
 196
196 -
 197
197 -
 198
198 -
 199
199 -
 200
200 -
 201
201 -
202
-
203
-
204
-
205
-
206
-
207
-
208
-
209
-
210
-
211
-
212
-
213
-
214
-
215
-
216
-
217
-
218
-
219
-
220
-
221
-
222
-
223
-
224
-
225
-
226
-
227
-
228
-
229
-
230
-
231
-
232
-
233
-
234
-
235
-
236
-
237
-
238
 |
 |

Sustainability statements 14.2.3
Annual Report 2015 191
•Proactively sourced by recruiter – Our dedicated in-
house sourcing function focuses solely on building
proactive talent pipelines and requires all
recruitment professionals to contribute to the
proactive identication of passive industry talent.
•Digital career channel (employee review sites,
social media sites, online community groups, etc.) –
In line with our overall focus on increasing our digital
footprint, our recruitment marketing team continued
to invest in Philips’ social employer brand and
recruiting activations in 2015, but took a more
targeted approach. As a result, we further improved
our online reach and delivered over 2,200 hired
candidates. Channel-specic indicators included an
increase of 3.2% in the Philips Talent Brand Index on
LinkedIn and positive trends in our Glassdoor.com
employee ratings since late Q3 2015. For employer
brand updates and company content, visit the
Philips LinkedIn Careers page
•Philips careers website – Our career website attracts
talent by emphasizing our Employer Value
Proposition through targeted information sharing
and storytelling from our employees and leadership
teams. The Philips global career website can be
found at www.philips.com/careers.
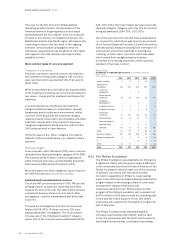
14.2.4 Health and Safety performance
In Philips, Health and Safety performance has
continued to improve. A number of sites showed
outstanding safety performance, for example the
Healthcare Pune site in India reached a signicant
milestone by achieving over 3 million man-hours
without a Lost Workday Injury Case (LWIC) by the end
of 2015 (over 3 years without an accident). In Glemsford,
UK, Consumer Lifestyle implemented a Lean Behavior
Based Safety program resulting in signicant
improvement in both incident statistics and overall safe
behavior for the entire site. It is viewed as an internal
best practice program with plans to be deployed
globally at all manufacturing units within Philips
beginning in 2016.
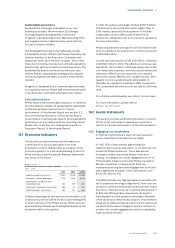
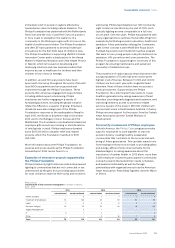
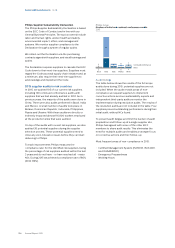
Philips Group
Lost workday injuries per 100 FTEs
2011 - 2015
2011 2012 2013 2014 2015
Healthcare 0.20 0.22 0.19 0.20 0.19
Consumer Lifestyle 0.23 0.25 0.24 0.12 0.13
Lighting 0.67 0.47 0.42 0.37 0.34
Innovation, Group &
Services 0.04 0.05 0.04 0.02 0.03
Continuing
operations 0.38 0.31 0.27 0.23 0.21
Discontinued
operations 0.59 0.55 0.37 0.25 0.27
Philips Group 0.38 0.31 0.28 0.23 0.22
Lighting
Lighting achieved a substantial reduction in reported
incident rates in recent years. In 2015, the number of
LWIC decreased to 119, compared with 132 in 2014. The
LWIC rate decreased to 0.34, compared with 0.37 in
2014. The number of Lost Workdays stayed on a similar
level with 4,832 days in 2015 due to longer-term
absences in a few cases. One major achievement was
a zero level of LWIC at 7 signicant industrial units (over
100 FTEs) in 2015. Eorts are being continued to further
reduce accident rates by focusing on injury prevention.
The injury prevention framework was launched in the
course of 2015 and is being integrated in the operational
Lean framework. It will continue in 2016.
Healthcare
Healthcare Health and Safety performance showed a
slight improvement in 2015. The number of LWIC
decreased to 69 compared with 72 in 2014. The LWIC
rate improved to 0.19 compared with 0.20 in 2014. The
total number of Lost Workdays remained stable at
2,240 days compared to 2,242 days in 2014. The
Healthcare Field Service Organization (FSO) became
the main contributor to the number of LWICs of the
sector, which is 54% of the sector total. The number of
LWICs increased to 37 from 31 in 2014, the number of
Lost Workdays in the FSO increased to 58% of the sector
total compared with 33% in 2014. Continued focus on a
formalized FSO Health and Safety global structure and
an increase in standardized safety program
deployment are among the improvement actions for
2016.
A major achievement in Healthcare for 2015 was a zero
level of LWIC at 13 industrial sites.
Consumer Lifestyle
Consumer Lifestyle showed a stable number of 21 LWIC
compared to 2014. The LWIC rate increased slightly, by
4% compared to 2014, to a level of 0.13. The number of
Lost Workdays decreased considerably, from 1608 to
649 days as recovery periods shortened. One major
achievement was a zero level of LWIC at 8 of the
Consumer Lifestyle industrial units, which is 50% of the
total number of Consumer Lifestyle industrial units.
14.2.5 General Business Principles
In 2015, 447 GBP complaints were led via the Philips
Ethics Line and the GBP Compliance Ocers.
Compared with 2014 (393 complaints), this represents
an increase of 14%.
This upward trend in the overall number of concerns
reported can be attributed primarily to signicantly
more concerns being reported in APAC and EMEA. In
Europe and the Middle East (24% of the total) (2014:
18%) there was an upward trend in terms of relative and
absolute numbers. The number of complaints in the
Asia Pacic region (20% of the total) increased
compared with 2014 (17%). Latin America fell back down
to 25% of the total number of reports (2014; 30%, 2013:
17%), whilst In North America although the percentage
declined the absolute number of complaints remained
stable, accounting for 31% of the total number in 2014
(2014: 35%).