Philips 2015 Annual Report Download - page 53
Download and view the complete annual report
Please find page 53 of the 2015 Philips annual report below. You can navigate through the pages in the report by either clicking on the pages listed below, or by using the keyword search tool below to find specific information within the annual report.-
 1
1 -
2
-
3
-
4
-
5
-
6
-
7
-
8
-
9
-
10
-
11
-
12
-
13
-
14
-
15
-
16
-
17
-
18
-
19
-
20
-
21
-
22
-
23
-
24
-
25
-
26
-
27
-
28
-
29
-
30
-
31
-
32
-
33
-
34
-
35
-
36
-
37
-
38
-
39
-
40
-
41
-
42
-
 43
43 -
 44
44 -
 45
45 -
 46
46 -
 47
47 -
 48
48 -
 49
49 -
 50
50 -
 51
51 -
 52
52 -
 53
53 -
 54
54 -
 55
55 -
 56
56 -
 57
57 -
 58
58 -
 59
59 -
 60
60 -
 61
61 -
 62
62 -
 63
63 -
64
-
65
-
66
-
67
-
68
-
69
-
70
-
71
-
72
-
73
-
74
-
75
-
76
-
77
-
78
-
79
-
80
-
81
-
82
-
83
-
84
-
85
-
86
-
87
-
88
-
89
-
90
-
91
-
92
-
93
-
94
-
95
-
96
-
97
-
98
-
99
-
100
-
101
-
102
-
103
-
104
-
105
-
106
-
107
-
108
-
109
-
110
-
111
-
112
-
113
-
114
-
115
-
116
-
117
-
118
-
119
-
120
-
121
-
122
-
123
-
124
-
125
-
126
-
127
-
128
-
129
-
130
-
131
-
132
-
133
-
134
-
135
-
136
-
137
-
138
-
139
-
140
-
141
-
142
-
143
-
144
-
145
-
146
-
147
-
148
-
149
-
150
-
151
-
152
-
153
-
154
-
155
-
156
-
157
-
158
-
159
-
160
-
161
-
162
-
163
-
164
-
165
-
166
-
167
-
168
-
169
-
170
-
171
-
172
-
173
-
174
-
175
-
176
-
177
-
178
-
179
-
180
-
181
-
182
-
183
-
184
-
185
-
186
-
187
-
188
-
189
-
190
-
191
-
192
-
193
-
194
-
195
-
196
-
197
-
198
-
199
-
200
-
201
-
202
-
203
-
204
-
205
-
206
-
207
-
208
-
209
-
210
-
211
-
212
-
213
-
214
-
215
-
216
-
217
-
218
-
219
-
220
-
221
-
222
-
223
-
224
-
225
-
226
-
227
-
228
-
229
-
230
-
231
-
232
-
233
-
234
-
235
-
236
-
237
-
238
 |
 |
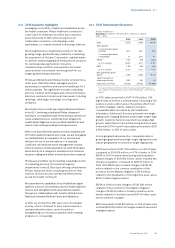
Sector performance 6.2.3
Annual Report 2015 53
• The new Philips Smart Air Purier 8000i series is a
high-performing air purier that helps to quickly
improve indoor air quality – even in larger rooms.
•At Kind + Jugend, the leading international baby and
toddler trade fair in Germany, Philips reinforced its
industry leadership, showcasing the Philips Avent
uGrow Platform, a new digital parenting platform
which supports the healthy development of babies.
• Empowering consumers to take greater control of
their health, Philips personal health programs were
announced at IFA Berlin, one of the world’s leading
trade shows for home appliances. Built upon the
Philips HealthSuite digital platform, each program
compromises connected health measurement
devices, an app-based personalized program with
coaching, and secure, cloud-based data analysis.
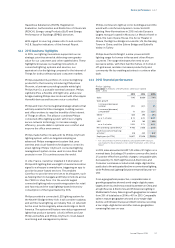
6.2.4 2015 nancial performance
Philips Consumer Lifestyle
Key data in millions of EUR unless otherwise stated
2013 - 2015
2013 2014 2015
Sales 4,605 4,731 5,347
Sales growth
% increase, nominal 7% 3% 13%
% increase, comparable1) 10% 6% 6%
EBITA 1) 483 573 673
as a % of sales 10.5% 12.1% 12.6%
EBIT 429 520 621
as a % of sales 9.3% 11.0% 11.6%
Net operating capital (NOC)1) 1,261 1,353 1,453
Cash ows before nancing
activities1) 480 553 589
Employees (in FTEs) 17,255 16,639 16,254
1) For a reconciliation to the most directly comparable GAAP measures,
see chapter 15, Reconciliation of non-GAAP information, of this Annual
Report
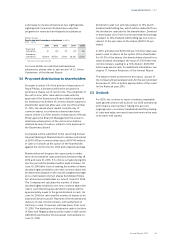
Sales amounted to EUR 5,347 million, a nominal
increase of 13% compared to 2014. Excluding a 7%
positive currency impact, comparable sales were 6%
higher year-on-year. Health & Wellness achieved
double-digit growth, Personal Care reported high-
single-digit growth, while Domestic Appliances was in
line with 2014. Green Product sales amounted to EUR
3,091 million, or 58% of total sector sales.
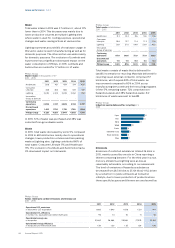
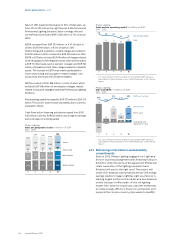
From a geographical perspective, growth geographies
achieved high-single-digit growth and mature
geographies registered low-single-digit growth. In
growth geographies, the increase was mainly driven by
Central & Eastern Europe, Asia Pacic and India,
primarily in the Health & Wellness and Personal Care
businesses. Growth geographies’ share of sector sales
was 48%, compared to 47% in 2014.
EBITA increased from EUR 573 million, or 12.1% of sales,
in 2014 to EUR 673 million, or 12.6% of sales, in 2015.
Restructuring and acquisition-related charges
amounted to EUR 36 million in 2015, compared to EUR
9 million in 2014. EBITA in 2015 also included charges
related to the devaluation of the Argentine peso of EUR
13 million. EBITA in 2014 also included a EUR 11 million
past-service pension cost gain. The year-on-
year EBITA increase was mainly driven by improved
earnings at Health & Wellness and Personal Care.
EBIT amounted to EUR 621 million, or 11.6% of sales,
which included EUR 52 million of amortization charges,
mainly related to acquired intangible assets at Health
& Wellness and Domestic Appliances.
Net operating capital increased from EUR 1,353 million
in 2014 to EUR 1,453 million in 2015, due to higher
working capital, partly oset by a reduction in
intangible xed assets.
Cash ows before nancing activities increased from
EUR 553 million in 2014 to EUR 589 million in 2015,
mainly due to higher earnings.
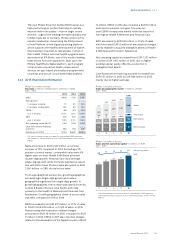
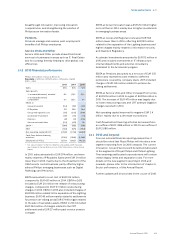
Philips Consumer Lifestyle
Sales per geographic cluster in millions of EUR
2011 - 2015
1,323
688
228
1,532
3,771
‘11
1,325
768
272
1,954
4,319
‘12
1,350
769
299
2,187
4,605
‘13
1,403
781
324
2,223
4,731
‘14
1,464 Western Europe
966 North America
354 Other mature
2,563 Growth
5,347
‘15
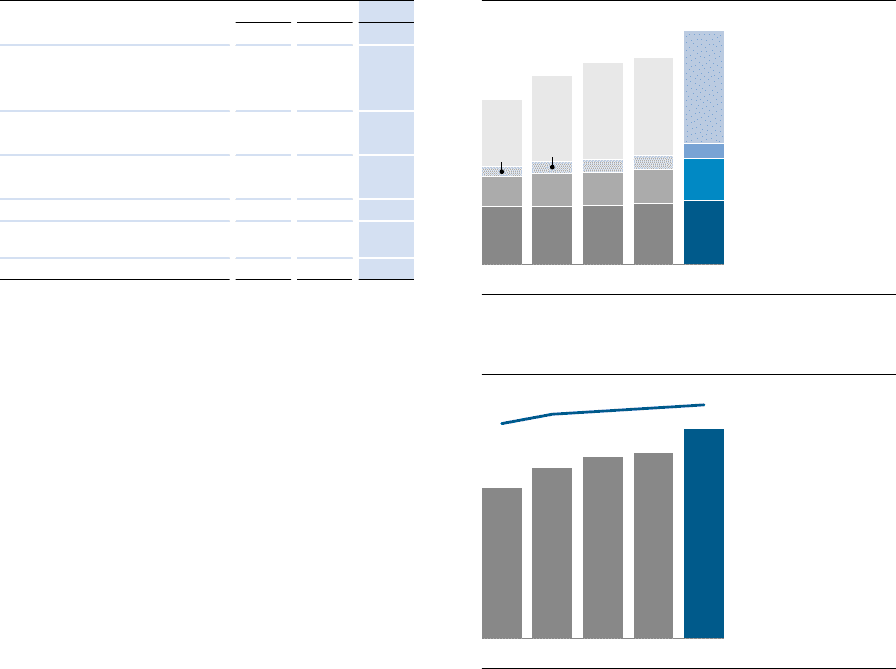
Philips Consumer Lifestyle
Sales and net operating capital1) in billions of EUR
2011 - 2015
3.8
‘11
4.3
‘12
4.6
‘13
4.7
‘14
5.3 Sales
‘15
0.9 1.2 1.3 1.4 1.5 Net operating capital
1) For a reconciliation to the most directly comparable GAAP measures,
see chapter 15, Reconciliation of non-GAAP information, of this Annual
Report