Philips 2015 Annual Report Download - page 24
Download and view the complete annual report
Please find page 24 of the 2015 Philips annual report below. You can navigate through the pages in the report by either clicking on the pages listed below, or by using the keyword search tool below to find specific information within the annual report.-
 1
1 -
2
-
3
-
4
-
5
-
6
-
7
-
8
-
9
-
10
-
11
-
12
-
13
-
 14
14 -
 15
15 -
 16
16 -
 17
17 -
 18
18 -
 19
19 -
 20
20 -
 21
21 -
 22
22 -
 23
23 -
 24
24 -
 25
25 -
 26
26 -
 27
27 -
 28
28 -
 29
29 -
 30
30 -
 31
31 -
 32
32 -
 33
33 -
 34
34 -
35
-
36
-
37
-
38
-
39
-
40
-
41
-
42
-
43
-
44
-
45
-
46
-
47
-
48
-
49
-
50
-
51
-
52
-
53
-
54
-
55
-
56
-
57
-
58
-
59
-
60
-
61
-
62
-
63
-
64
-
65
-
66
-
67
-
68
-
69
-
70
-
71
-
72
-
73
-
74
-
75
-
76
-
77
-
78
-
79
-
80
-
81
-
82
-
83
-
84
-
85
-
86
-
87
-
88
-
89
-
90
-
91
-
92
-
93
-
94
-
95
-
96
-
97
-
98
-
99
-
100
-
101
-
102
-
103
-
104
-
105
-
106
-
107
-
108
-
109
-
110
-
111
-
112
-
113
-
114
-
115
-
116
-
117
-
118
-
119
-
120
-
121
-
122
-
123
-
124
-
125
-
126
-
127
-
128
-
129
-
130
-
131
-
132
-
133
-
134
-
135
-
136
-
137
-
138
-
139
-
140
-
141
-
142
-
143
-
144
-
145
-
146
-
147
-
148
-
149
-
150
-
151
-
152
-
153
-
154
-
155
-
156
-
157
-
158
-
159
-
160
-
161
-
162
-
163
-
164
-
165
-
166
-
167
-
168
-
169
-
170
-
171
-
172
-
173
-
174
-
175
-
176
-
177
-
178
-
179
-
180
-
181
-
182
-
183
-
184
-
185
-
186
-
187
-
188
-
189
-
190
-
191
-
192
-
193
-
194
-
195
-
196
-
197
-
198
-
199
-
200
-
201
-
202
-
203
-
204
-
205
-
206
-
207
-
208
-
209
-
210
-
211
-
212
-
213
-
214
-
215
-
216
-
217
-
218
-
219
-
220
-
221
-
222
-
223
-
224
-
225
-
226
-
227
-
228
-
229
-
230
-
231
-
232
-
233
-
234
-
235
-
236
-
237
-
238
 |
 |
Group performance 5.1
24 Annual Report 2015
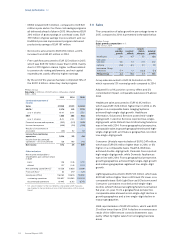
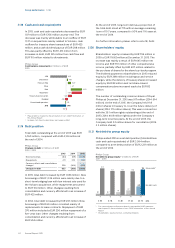
• EBITA totaled EUR 1.4 billion, compared to EUR 821
million a year earlier. Our three cost savings programs
all delivered ahead of plan in 2015. We achieved EUR
290 million of gross savings in overhead costs, EUR
379 million of gross savings in procurement, and our
End2End process improvement program delivered
productivity savings of EUR 187 million.
• Net income amounted to EUR 659 million, a 60%
increase from EUR 411 million in 2014.
• Free cash ow amounted to EUR 325 million in 2015,
which was EUR 172 million lower than in 2014, mainly
due to CRT litigation claims, higher outows related
to pension de-risking settlements, and net capital
expenditures, partly oset by higher earnings.
•By the end of the year we had also completed 74% of
the EUR 1.5 billion- share buy-back program.
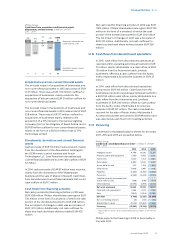
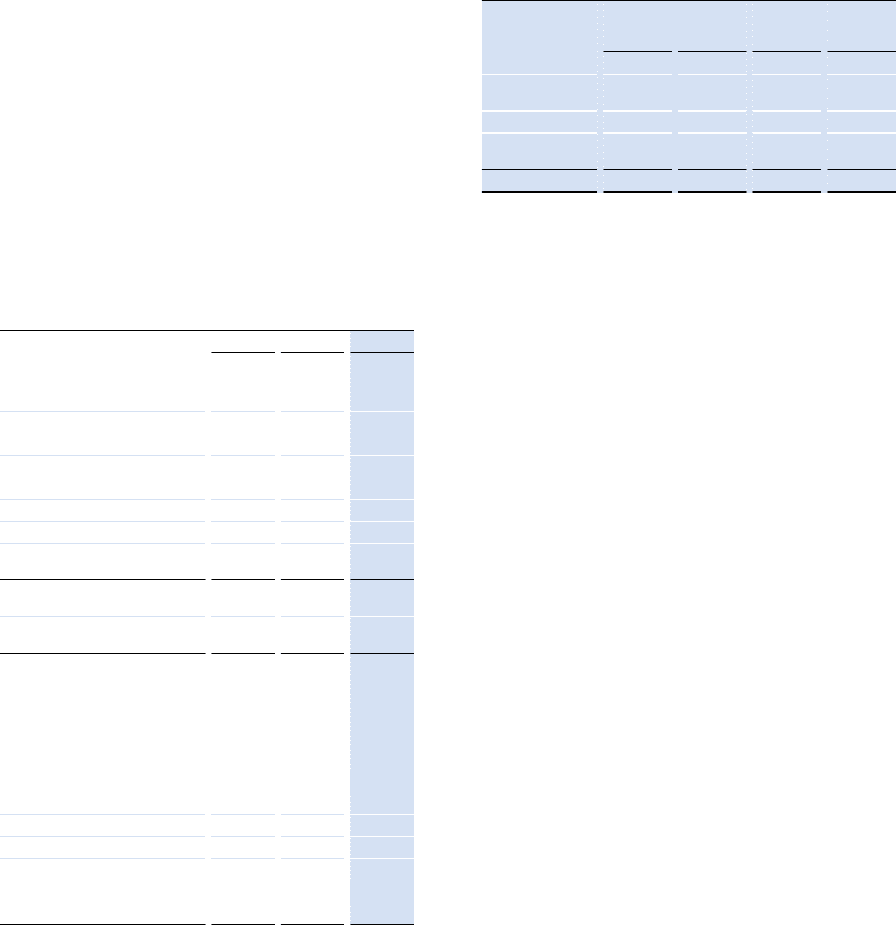
Philips Group
Key data in millions of EUR unless otherwise stated
2013 - 2015
2013 2014 2015
Condensed statement of
income
Sales 21,990 21,391 24,244
EBITA 1) 2,276 821 1,372
as a % of sales 10.4% 3.8% 5.7%
EBIT 1,855 486 992
as a % of sales 8.4% 2.3% 4.1%
Financial income and expenses (330) (301) (369)
Income tax expense (466) (26) (239)
Results of investments in
associates (25) 62 30
Income from continuing
operations 1,034 221 414
Income from discontinued
operations - net of income tax 138 190 245
Net income 1,172 411 659
Other indicators
Net income attributable to
shareholders per common share
in EUR:
basic 1.28 0.45 0.70
diluted 1.27 0.45 0.70
Net operating capital (NOC)1) 10,238 8,838 11,096
Free cash ow1) 82 497 325
Employees (FTEs) 116,082 113,678 112,959
continuing operations 105,637 105,365 104,204
discontinued operations 10,445 8,313 8,755
1) For a reconciliation to the most directly comparable GAAP measures,
see chapter 15, Reconciliation of non-GAAP information, of this Annual
Report
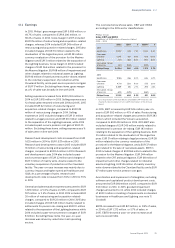
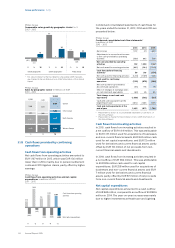
5.1.1 Sales
The composition of sales growth in percentage terms in
2015, compared to 2014, is presented in the table below.
Philips Group
Sales growth composition in %
2015 versus 2014
com-
parable
growth
currency
eects
consoli-
dation
changes
nominal
growth
Healthcare 3.8 11.7 3.3 18.8
Consumer
Lifestyle 5.8 7.2 0.0 13.0
Lighting (2.8) 8.5 2.2 7.9
Innovation, Group
& Services 5.4 1.7 (12.2) (5.1)
Philips Group 2.2 9.4 1.7 13.3
Group sales amounted to EUR 24,244 million in 2015,
which represents 13% nominal growth compared to 2014.
Adjusted for a 9% positive currency eect and 2%
consolidation impact, comparable sales were 2% above
2014.
Healthcare sales amounted to EUR 10,912 million,
which was EUR 1,726 million higher than in 2014 or 4%
higher on a comparable basis. Imaging Systems
achieved high-single-digit growth, Healthcare
Informatics, Solutions & Services posted mid-single-
digit growth, Customer Services reported low-single-
digit growth, while Patient Care & Monitoring Solutions
was in line with 2014. From a geographical perspective,
comparable sales in growth geographies showed high-
single-digit growth, and mature geographies recorded
low-single-digit growth.
Consumer Lifestyle reported sales of EUR 5,347 million,
which was EUR 616 million higher than in 2014, or 6%
higher on a comparable basis. Health & Wellness
achieved double-digit growth, Personal Care reported
high-single-digit growth, while Domestic Appliances
was in line with 2014. From a geographical perspective,
growth geographies achieved high-single-digit growth
and mature geographies registered low-single-digit
growth.
Lighting sales amounted to EUR 7,411 million, which was
EUR 542 million higher than in 2014 and 3% lower on a
comparable basis. Both Light Sources & Electronics and
Consumer Luminaires recorded a mid-single-digit
decline, while Professional Lighting Solutions remained
at year-on-year. From a geographical perspective,
comparable sales showed a mid-single-digit decline in
growth geographies and a low-single-digit decline in
mature geographies.
IG&S reported sales of EUR 574 million, which was EUR
31 million lower than in 2014. A decline in revenues as a
result of the OEM remote controls divestment, was
partly oset by higher sales from emerging business
areas.