Philips 2015 Annual Report Download - page 224
Download and view the complete annual report
Please find page 224 of the 2015 Philips annual report below. You can navigate through the pages in the report by either clicking on the pages listed below, or by using the keyword search tool below to find specific information within the annual report.-
 1
1 -
2
-
3
-
4
-
5
-
6
-
7
-
8
-
9
-
10
-
11
-
12
-
13
-
14
-
15
-
16
-
17
-
18
-
19
-
20
-
21
-
22
-
23
-
24
-
25
-
26
-
27
-
28
-
29
-
30
-
31
-
32
-
33
-
34
-
35
-
36
-
37
-
38
-
39
-
40
-
41
-
42
-
43
-
44
-
45
-
46
-
47
-
48
-
49
-
50
-
51
-
52
-
53
-
54
-
55
-
56
-
57
-
58
-
59
-
60
-
61
-
62
-
63
-
64
-
65
-
66
-
67
-
68
-
69
-
70
-
71
-
72
-
73
-
74
-
75
-
76
-
77
-
78
-
79
-
80
-
81
-
82
-
83
-
84
-
85
-
86
-
87
-
88
-
89
-
90
-
91
-
92
-
93
-
94
-
95
-
96
-
97
-
98
-
99
-
100
-
101
-
102
-
103
-
104
-
105
-
106
-
107
-
108
-
109
-
110
-
111
-
112
-
113
-
114
-
115
-
116
-
117
-
118
-
119
-
120
-
121
-
122
-
123
-
124
-
125
-
126
-
127
-
128
-
129
-
130
-
131
-
132
-
133
-
134
-
135
-
136
-
137
-
138
-
139
-
140
-
141
-
142
-
143
-
144
-
145
-
146
-
147
-
148
-
149
-
150
-
151
-
152
-
153
-
154
-
155
-
156
-
157
-
158
-
159
-
160
-
161
-
162
-
163
-
164
-
165
-
166
-
167
-
168
-
169
-
170
-
171
-
172
-
173
-
174
-
175
-
176
-
177
-
178
-
179
-
180
-
181
-
182
-
183
-
184
-
185
-
186
-
187
-
188
-
189
-
190
-
191
-
192
-
193
-
194
-
195
-
196
-
197
-
198
-
199
-
200
-
201
-
202
-
203
-
204
-
205
-
206
-
207
-
208
-
209
-
210
-
211
-
212
-
213
-
 214
214 -
 215
215 -
 216
216 -
 217
217 -
 218
218 -
 219
219 -
 220
220 -
 221
221 -
 222
222 -
 223
223 -
 224
224 -
 225
225 -
 226
226 -
 227
227 -
 228
228 -
 229
229 -
 230
230 -
 231
231 -
 232
232 -
 233
233 -
 234
234 -
235
-
236
-
237
-
238
 |
 |
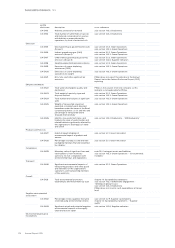
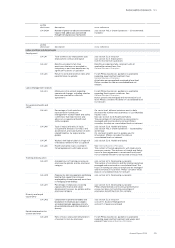
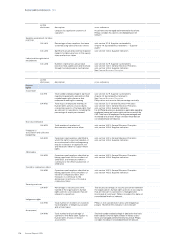
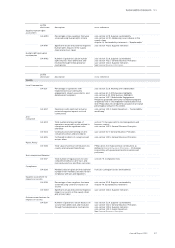
Five-year overview 16
224 Annual Report 2015
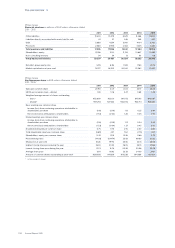
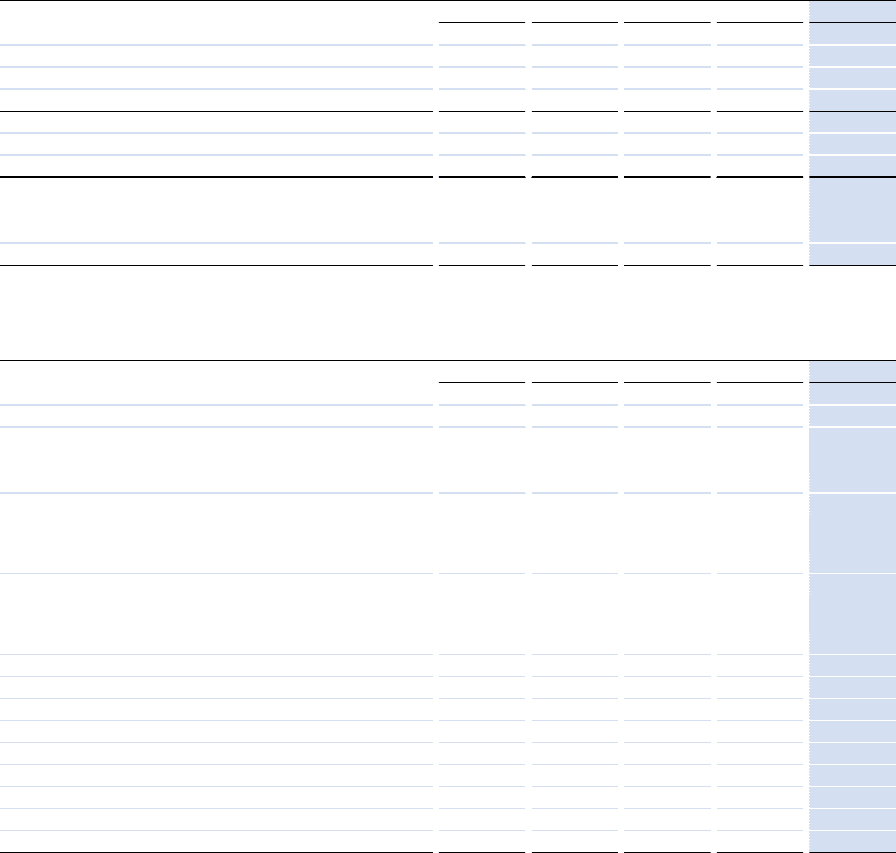
Philips Group
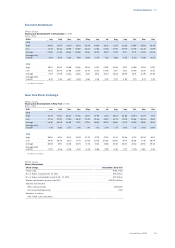
Financial structure in millions of EUR unless otherwise stated
2011 - 2015
2011 2012 2013 2014 2015
Other liabilities 10,434 10,379 8,529 9,486 9,804
Liabilities directly associated with assets held for sale 61 27 348 349 407
Debt 3,860 4,534 3,901 4,104 5,760
Provisions 2,680 2,956 2,554 3,445 3,225
Total provisions and liabilities 17,035 17,896 15,332 17,384 19,196
Shareholders’ equity 12,328 11,151 11,214 10,867 11,662
Non-controlling interests 34 34 13 101 118
Group equity and liabilities 29,397 29,081 26,559 28,352 30,976
Net debt: group equity ratio 5:95 6:94 11:89 17:83 25:75
Market capitalization at year-end 15,077 18,200 24,340 22,082 21,607
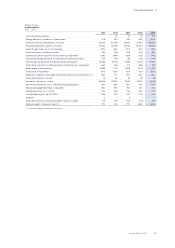
Philips Group
Key gures per share in EUR unless otherwise stated
2011 - 2015
2011 2012 2013 2014 2015
Sales per common share 20.90 24.11 24.14 23.37 26.46
EBITA per common share - diluted 1.39 1.08 2.47 0.89 1.49
Weighted average amount of shares outstanding:
- basic1) 952,809 922,101 911,072 915,193 916,087
- diluted1) 957,293 927,222 922,072 922,714 923,625
Basic earnings per common share:
Income (loss) from continuing operations attributable to
shareholders per share (1.16) (0.19) 1.13 0.25 0.44
Net income (loss) attributable to shareholders (1.53) (0.04) 1.28 0.45 0.70
Diluted earnings per common share:
Income (loss) from continuing operations attributable to
shareholders per share (1.16) (0.19) 1.12 0.24 0.43
Net income (loss) attributable to shareholders (1.53) (0.04) 1.27 0.45 0.70
Dividend distributed per common share 0.75 0.75 0.75 0.80 0.80
Total shareholder return per common share (5.89) 4.37 7.50 (1.70) 0.21
Shareholders’ equity per common share 13.31 12.19 12.28 11.88 12.72
Price/earnings ratio (14.03) (104.74) 23.58 96.60 53.55
Share price at year-end 16.28 19.90 26.65 24.15 23.56
Highest closing share price during the year 25.34 20.33 26.78 28.10 27.65
Lowest closing share price during the year 12.23 13.76 20.26 20.98 20.79
Average share price 18.11 16.92 23.33 24.00 24.51
Amount of common shares outstanding at year-end1) 926,095 914,591 913,338 914,389 917,104
1) In thousands of shares