Philips 2015 Annual Report Download - page 25
Download and view the complete annual report
Please find page 25 of the 2015 Philips annual report below. You can navigate through the pages in the report by either clicking on the pages listed below, or by using the keyword search tool below to find specific information within the annual report.-
 1
1 -
2
-
3
-
4
-
5
-
6
-
7
-
8
-
9
-
10
-
11
-
12
-
13
-
14
-
 15
15 -
 16
16 -
 17
17 -
 18
18 -
 19
19 -
 20
20 -
 21
21 -
 22
22 -
 23
23 -
 24
24 -
 25
25 -
 26
26 -
 27
27 -
 28
28 -
 29
29 -
 30
30 -
 31
31 -
 32
32 -
 33
33 -
 34
34 -
 35
35 -
36
-
37
-
38
-
39
-
40
-
41
-
42
-
43
-
44
-
45
-
46
-
47
-
48
-
49
-
50
-
51
-
52
-
53
-
54
-
55
-
56
-
57
-
58
-
59
-
60
-
61
-
62
-
63
-
64
-
65
-
66
-
67
-
68
-
69
-
70
-
71
-
72
-
73
-
74
-
75
-
76
-
77
-
78
-
79
-
80
-
81
-
82
-
83
-
84
-
85
-
86
-
87
-
88
-
89
-
90
-
91
-
92
-
93
-
94
-
95
-
96
-
97
-
98
-
99
-
100
-
101
-
102
-
103
-
104
-
105
-
106
-
107
-
108
-
109
-
110
-
111
-
112
-
113
-
114
-
115
-
116
-
117
-
118
-
119
-
120
-
121
-
122
-
123
-
124
-
125
-
126
-
127
-
128
-
129
-
130
-
131
-
132
-
133
-
134
-
135
-
136
-
137
-
138
-
139
-
140
-
141
-
142
-
143
-
144
-
145
-
146
-
147
-
148
-
149
-
150
-
151
-
152
-
153
-
154
-
155
-
156
-
157
-
158
-
159
-
160
-
161
-
162
-
163
-
164
-
165
-
166
-
167
-
168
-
169
-
170
-
171
-
172
-
173
-
174
-
175
-
176
-
177
-
178
-
179
-
180
-
181
-
182
-
183
-
184
-
185
-
186
-
187
-
188
-
189
-
190
-
191
-
192
-
193
-
194
-
195
-
196
-
197
-
198
-
199
-
200
-
201
-
202
-
203
-
204
-
205
-
206
-
207
-
208
-
209
-
210
-
211
-
212
-
213
-
214
-
215
-
216
-
217
-
218
-
219
-
220
-
221
-
222
-
223
-
224
-
225
-
226
-
227
-
228
-
229
-
230
-
231
-
232
-
233
-
234
-
235
-
236
-
237
-
238
 |
 |

Group performance 5.1.2
Annual Report 2015 25
5.1.2 Earnings
In 2015, Philips’ gross margin was EUR 9,856 million, or
40.7% of sales, compared to EUR 8,206 million, or
38.4% of sales, in 2014. Gross margin in 2015 included
EUR 176 million of restructuring and acquisition-related
charges, whereas 2014 included EUR 249 million of
restructuring and acquisition-related charges. 2015 also
included charges of EUR 35 million related to the
devaluation of the Argentine peso, a EUR 28 million
currency revaluation of the provision for the Masimo
litigation and EUR 3 million related to the separation of
the Lighting business. Gross margin in 2014 included
charges of EUR 366 million related to the provision for
the Masimo litigation, EUR 68 million of impairment and
other charges related to industrial assets at Lighting,
EUR 46 million of mainly inventory write-downs related
to the voluntary suspension of production at the
Cleveland facility, and a past-service pension cost gain
of EUR 17 million. Excluding these items, gross margin
as a % of sales was broadly in line with 2014.
Selling expenses increased from EUR 5,124 million in
2014 to EUR 5,815 million in 2015. Selling expenses as a
% of total sales remained in line with 2014 at 24.0%. 2015
included EUR 62 million of restructuring and
acquisition-related charges, compared to EUR 128
million of restructuring charges in 2014. Selling
expenses in 2015 included charges of EUR 31 million
related to a legal provision and EUR 69 million related
to the separation of the Lighting business, while 2014
included a past-service pension cost gain of EUR 20
million. Excluding these items, selling expenses as a %
of sales were in line with 2014.
Research and development costs increased from EUR
1,635 million in 2014 to EUR 1,927 million in 2015.
Research and development costs in 2015 included EUR
16 million of restructuring and acquisition-related
charges, compared to EUR 34 million in 2014. Research
and development costs 2014 also included a past-
service pension gain of EUR 22 million and charges of
EUR 3 million of mainly write-downs related to the
voluntary suspension of production at the Cleveland
facility. The year-on-year increase was mainly due to
currency impact and higher spend at Healthcare and
IG&S. As a percentage of sales, research and
development costs increased from 7.6% in 2014 to 7.9%
in 2015.
General and administrative expenses amounted to EUR
1,209 million, or 5.0% of sales, in 2015, compared to EUR
747 million, or 3.5% of sales, in 2014. 2015 included EUR
30 million of restructuring and acquisition related-
charges, compared to EUR 23 million in 2014. 2015 also
included charges of EUR 345 million mainly related to
settlements for pension de-risking and EUR 111 million
related to the separation of the Lighting business, while
2014 included a past-service pension cost gain of EUR
8 million. Excluding these items, the year-on-year
decrease was driven by reductions in all operating
sectors.
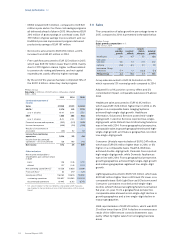
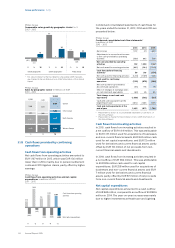
The overview below shows sales, EBIT and EBITA
according to the 2015 sector classications.
Philips Group
Sales, EBIT and EBITA
in millions of EUR unless otherwise stated
2014 - 2015
Sales EBIT % EBITA1) %
2015
Healthcare 10,912 819 7.5% 1,024 9.4%
Consumer
Lifestyle 5,347 621 11.6% 673 12.6%
Lighting 7,411 486 6.6% 594 8.0%
Innovation, Group
& Services 574 (934) - (919) -
Philips Group 24,244 992 4.1% 1,372 5.7%
2014
Healthcare 9,186 456 5.0% 616 6.7%
Consumer
Lifestyle 4,731 520 11.0% 573 12.1%
Lighting 6,869 185 2.7% 293 4.3%
Innovation, Group
& Services 605 (675) - (661) -
Philips Group 21,391 486 2.3% 821 3.8%
1)
For a reconciliation to the most directly comparable GAAP measures, see
chapter 15, Reconciliation of non-GAAP information, of this Annual
Report
In 2015, EBIT increased by EUR 506 million year-on-
year to EUR 992 million, or 4.1% of sales. Restructuring
and acquisition-related charges amounted to EUR 283
million, which included the Volcano acquisition,
compared to EUR 434 million in 2014. 2015 EBIT also
included charges of EUR 345 million mainly related to
settlements for pension de-risking, EUR 183 million
relating to the separation of the Lighting business, EUR
35 million related to the devaluation of the Argentine
peso, EUR 31 million relating to legal provisions, EUR 28
million related to the currency revaluation of the
provision for the Masimo litigation, and a EUR 37 million
gain related to the sale of real estate assets. EBIT in
2014 included charges of EUR 366 million related to the
provision for the Masimo litigation, EUR 244 million
related to the CRT antitrust litigation, EUR 68 million of
impairment and other charges related to industrial
assets at Lighting, EUR 49 million of mainly inventory
write-downs related to the Cleveland facility, and a EUR
67 million past-service pension cost gain.
Amortization and impairment of intangibles, excluding
software and capitalized product development costs,
amounted to EUR 380 million in 2015, compared to EUR
332 million in 2014. In 2015, goodwill impairment
charges amounted to nil, while 2014 included charges
of EUR 3 million consisting of impairments on divested
businesses in Healthcare and Lighting, see note 11,
Goodwill.
EBITA increased from EUR 821 million, or 3.8% of sales,
in 2014 to EUR 1,372 million, or 5.7% of sales, in
2015. EBITA showed a year-on-year increase at all
sectors except IG&S.