Philips 2015 Annual Report Download - page 27
Download and view the complete annual report
Please find page 27 of the 2015 Philips annual report below. You can navigate through the pages in the report by either clicking on the pages listed below, or by using the keyword search tool below to find specific information within the annual report.-
 1
1 -
2
-
3
-
4
-
5
-
6
-
7
-
8
-
9
-
10
-
11
-
12
-
13
-
14
-
15
-
16
-
 17
17 -
 18
18 -
 19
19 -
 20
20 -
 21
21 -
 22
22 -
 23
23 -
 24
24 -
 25
25 -
 26
26 -
 27
27 -
 28
28 -
 29
29 -
 30
30 -
 31
31 -
 32
32 -
 33
33 -
 34
34 -
 35
35 -
 36
36 -
 37
37 -
38
-
39
-
40
-
41
-
42
-
43
-
44
-
45
-
46
-
47
-
48
-
49
-
50
-
51
-
52
-
53
-
54
-
55
-
56
-
57
-
58
-
59
-
60
-
61
-
62
-
63
-
64
-
65
-
66
-
67
-
68
-
69
-
70
-
71
-
72
-
73
-
74
-
75
-
76
-
77
-
78
-
79
-
80
-
81
-
82
-
83
-
84
-
85
-
86
-
87
-
88
-
89
-
90
-
91
-
92
-
93
-
94
-
95
-
96
-
97
-
98
-
99
-
100
-
101
-
102
-
103
-
104
-
105
-
106
-
107
-
108
-
109
-
110
-
111
-
112
-
113
-
114
-
115
-
116
-
117
-
118
-
119
-
120
-
121
-
122
-
123
-
124
-
125
-
126
-
127
-
128
-
129
-
130
-
131
-
132
-
133
-
134
-
135
-
136
-
137
-
138
-
139
-
140
-
141
-
142
-
143
-
144
-
145
-
146
-
147
-
148
-
149
-
150
-
151
-
152
-
153
-
154
-
155
-
156
-
157
-
158
-
159
-
160
-
161
-
162
-
163
-
164
-
165
-
166
-
167
-
168
-
169
-
170
-
171
-
172
-
173
-
174
-
175
-
176
-
177
-
178
-
179
-
180
-
181
-
182
-
183
-
184
-
185
-
186
-
187
-
188
-
189
-
190
-
191
-
192
-
193
-
194
-
195
-
196
-
197
-
198
-
199
-
200
-
201
-
202
-
203
-
204
-
205
-
206
-
207
-
208
-
209
-
210
-
211
-
212
-
213
-
214
-
215
-
216
-
217
-
218
-
219
-
220
-
221
-
222
-
223
-
224
-
225
-
226
-
227
-
228
-
229
-
230
-
231
-
232
-
233
-
234
-
235
-
236
-
237
-
238
 |
 |

Group performance 5.1.5
Annual Report 2015 27
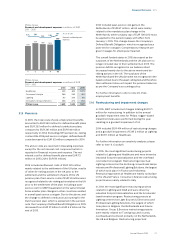
Philips Group
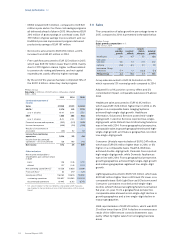
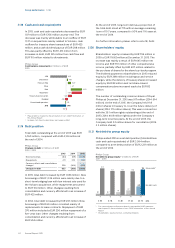
Research and development expenses in millions of EUR
2011 - 2015
1,543
‘11
1,724
‘12
1,659
‘13
1,635
‘14
1,927 Research and development
expenses
‘15
7.7% 7.8%
7.5% 7.6%
7.9% As a % of sales
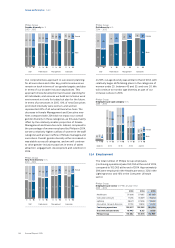
Philips Group
Research and development expenses in millions of EUR
2013 - 2015
2013 2014 2015
Healthcare 810 822 1,073
Consumer Lifestyle 268 263 301
Lighting 313 330 315
Innovation, Group & Services 268 220 238
Philips Group 1,659 1,635 1,927
5.1.5 Pensions
In 2015, the total costs of post-employment benets
amounted to EUR 559 million for dened benet plans
and EUR 293 million for dened contribution plans,
compared to EUR 241 million and EUR 144 million
respectively in 2014. Excluding 2015 pension de-risking
cost and the 2014 past service cost gain, dened benet
costs decreased by EUR 92 million compared to 2014.
The above costs are reported in Operating expenses
except for the net interest cost component which is
reported in Financial income and expense. The net
interest cost for dened benet plans was EUR 72
million in 2015 (2014: EUR 59 million).
2015 included settlement costs of EUR 329 million
mainly related to the settlement of the UK plan, results
of other de-risking actions in the UK prior to the
settlement and the settlement of parts of the US
pension plan. Past-service costs of EUR 14 million were
recognized related to de-risking actions taken in the UK
prior to the settlement of the plan, including a past-
service cost for GMP Equalization in the same UK plan.
Some smaller plan changes in other countries resulted
in a small past service cost gain. Due to the above, and
the change to dened contribution accounting for the
Dutch pension plan, which is explained in the pension
note, the Company’s Dened Benet Obligation in 2015
decreased from EUR 27 billion to EUR 4.5 billion at the
end of 2015.
2014 included past-service cost gains in the
Netherlands of EUR 67 million, which were mainly
related to the mandatory plan change in the
Netherlands, where a salary cap of EUR 100,000 must
be applied to the pension salary with eect from
January 1, 2015. This change lowers the Company’s
Dened Benet Obligation, which is recognized as a
past-service cost gain. Compensatory measures are
given in wages for employees impacted.
The overall funded status in 2015 decreased as the
surpluses of the Netherlands and the UK plan are no
longer included due to their settlements in 2015. The
pension decits recognized in our balance sheet
decreased mainly due to the above mentioned de-
risking actions in the US. The surpluses of the
Netherlands and the UK plan were not recognized in the
balance sheet due to the asset ceiling test and therefore
their settlement does not impact the pension balances
as per the Company’s accounting policy.
For further information, refer to note 20, Post-
employment benets.
5.1.6 Restructuring and impairment charges
In 2015, EBIT included net charges totaling EUR 171
million for restructuring. In addition to the annual
goodwill-impairment tests for Philips, trigger-based
impairment tests were performed during the year,
resulting in a goodwill impairment of nil.
2014 included EUR 414 million of restructuring charges
and a goodwill impairment of EUR 2 million at Lighting
and EUR 1 million at Healthcare.
For further information on sensitivity analysis, please
refer to note 11, Goodwill.
In 2015, the most signicant restructuring projects
related to Lighting and Healthcare and were driven by
industrial footprint rationalization and the overhead
cost reduction program. Restructuring projects at
Lighting centered on the declining conventional lamps
industry and Professional Lighting Solutions, the largest
of which took place in France and Indonesia.
Restructuring projects at Healthcare mainly took place
in the US and France. Consumer Lifestyle restructuring
projects were mainly related to Italy.
In 2014, the most signicant restructuring projects
related to Lighting and IG&S and were driven by
industrial footprint rationalization and the Accelerate!
transformation program. Restructuring projects at
Lighting centered on Light Sources & Electronics and
Professional Lighting Solutions, the largest of which
took place in Belgium, the Netherlands and France.
Innovation, Group & Services restructuring projects
were mainly related to IT and group and country
overheads and centered primarily on the Netherlands,
the US and Belgium. Restructuring projects at