Philips 2015 Annual Report Download - page 43
Download and view the complete annual report
Please find page 43 of the 2015 Philips annual report below. You can navigate through the pages in the report by either clicking on the pages listed below, or by using the keyword search tool below to find specific information within the annual report.-
 1
1 -
2
-
3
-
4
-
5
-
6
-
7
-
8
-
9
-
10
-
11
-
12
-
13
-
14
-
15
-
16
-
17
-
18
-
19
-
20
-
21
-
22
-
23
-
24
-
25
-
26
-
27
-
28
-
29
-
30
-
31
-
32
-
 33
33 -
 34
34 -
 35
35 -
 36
36 -
 37
37 -
 38
38 -
 39
39 -
 40
40 -
 41
41 -
 42
42 -
 43
43 -
 44
44 -
 45
45 -
 46
46 -
 47
47 -
 48
48 -
 49
49 -
 50
50 -
 51
51 -
 52
52 -
 53
53 -
54
-
55
-
56
-
57
-
58
-
59
-
60
-
61
-
62
-
63
-
64
-
65
-
66
-
67
-
68
-
69
-
70
-
71
-
72
-
73
-
74
-
75
-
76
-
77
-
78
-
79
-
80
-
81
-
82
-
83
-
84
-
85
-
86
-
87
-
88
-
89
-
90
-
91
-
92
-
93
-
94
-
95
-
96
-
97
-
98
-
99
-
100
-
101
-
102
-
103
-
104
-
105
-
106
-
107
-
108
-
109
-
110
-
111
-
112
-
113
-
114
-
115
-
116
-
117
-
118
-
119
-
120
-
121
-
122
-
123
-
124
-
125
-
126
-
127
-
128
-
129
-
130
-
131
-
132
-
133
-
134
-
135
-
136
-
137
-
138
-
139
-
140
-
141
-
142
-
143
-
144
-
145
-
146
-
147
-
148
-
149
-
150
-
151
-
152
-
153
-
154
-
155
-
156
-
157
-
158
-
159
-
160
-
161
-
162
-
163
-
164
-
165
-
166
-
167
-
168
-
169
-
170
-
171
-
172
-
173
-
174
-
175
-
176
-
177
-
178
-
179
-
180
-
181
-
182
-
183
-
184
-
185
-
186
-
187
-
188
-
189
-
190
-
191
-
192
-
193
-
194
-
195
-
196
-
197
-
198
-
199
-
200
-
201
-
202
-
203
-
204
-
205
-
206
-
207
-
208
-
209
-
210
-
211
-
212
-
213
-
214
-
215
-
216
-
217
-
218
-
219
-
220
-
221
-
222
-
223
-
224
-
225
-
226
-
227
-
228
-
229
-
230
-
231
-
232
-
233
-
234
-
235
-
236
-
237
-
238
 |
 |
Group performance 5.3.2
Annual Report 2015 43
Lighting
Green Product sales within Philips Lighting increased to
72% in 2015. Connected lighting systems contributed to
Green Product sales with solutions in more applications
and market segments. In August 2015 the new
installation of the connected Philips LED lighting
system in the Allianz Arena made it Germany’s rst and
Europe’s largest stadium to feature a dynamic and
colorful light display on its entire façade. This new
energy-ecient lighting system also saves
approximately 60% on electricity and 362 tons of CO2
per year. The maintenance and operating costs are also
lower due to the cloud-based Philips ActiveSite
platform. The LEDs have an average lifetime of 80,000
operating hours and the system is extremely robust,
even under extreme weather conditions.
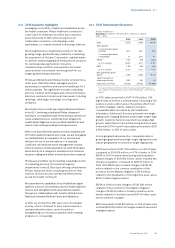
5.3.3 Green Operations
The Green Operations program focuses on the main
contributors to climate change, recycling of waste,
reduction of water consumption, and reduction of
emissions of restricted and hazardous substances. Full
details can be found in chapter 14, Sustainability
statements, of this Annual Report.
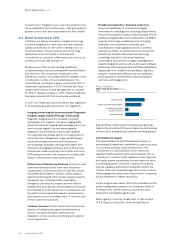
Carbon footprint and energy eciency
After achieving our EcoVision4 carbon emissions
reduction target in 2012, we continued our energy
eciency improvement programs across dierent
disciplines. This year we have achieved our 2015
emission reduction target that was set at a 40%
decrease in CO2 reductions compared to our 2007 base
year. Our carbon footprint decreased by 7% compared
to 2014, resulting in a total of 1,417 kilotonnes CO2, a 41%
decrease compared to 2007. This was mainly achieved
by emissions reductions of 17% compared to 2014 in our
manufacturing facilities, resulting from operational
changes and decreased energy usage due to lower load
at energy intensive Lighting factories. Additionally the
energy intensity for our non-industrial operations
decreased resulting in emission reductions of 16%.
Business travel emissions showed a slight reduction of
1% compared to 2014. In order to further decrease our
business travel emissions we will continue to promote
video conferencing as an alternative to travel in 2016.
These reductions were, however, oset by a 23%
increase in emissions from air transport over the course
of 2015, mainly at Healthcare to meet demand.
Our operational energy eciency improved by 18%,
from 1.29 terajoules per million euro sales in 2014 to 1.06
terajoules per million euro sales in 2015 as a result of
energy eciency programs in our industrial sites.
During 2015, the applied emission factors used to
calculate our operational carbon footprint have been
updated from the previously used DEFRA (UK
Department for Environment, Food & Rural Aairs)
2007 and bespoke emission factors to the applicable
DEFRA 2015 emission factors for each year respectively.
This update aected all historical data and resulted in
an overall average increase of our carbon emissions by
11% for all years. We implemented these new emission
factors to ensure improved carbon disclosure. The
emission factor update did not aect our performance
against the base year.
From this year onward our scope 2 emissions reporting
will include both the market based method as well as
the location based method. Both methods are adopted
according to the new Corporate Standard of the
Greenhouse Gas (GHG) Protocol as further described in
chapter 14, Sustainability statements, of this Annual
Report. The market based method will serve as
reference for calculating our total operational carbon
footprint. As explained in chapter 14, the market based
method includes reduction of our emissions resulting
from purchasing renewable energy. In 2015, we
procured 54% of our electricity from renewable sources.
Approximately 60% of our renewable energy is
standardly contracted via our energy providers. The
remaining 40% was mainly sourced in the United States
through procurement of renewable energy certicates.
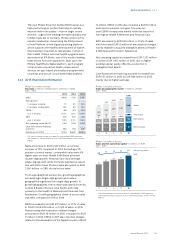
The impact of the exclusion of Lumileds and
Automotive is displayed as discontinued operations in
the next graph; the size of which varies over the years,
but averages around 10% over the past 5 years.
Emissions from discontinued operations in our
industrial activities have been identied exactly.
Emissions from our non-industrial facilities and
business travel have been estimated based on FTE
data. For our logistics emissions the part of
discontinued operations has been estimated using
revenue share as a proxy where applicable.
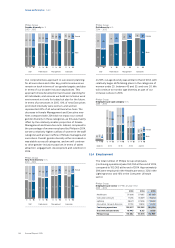
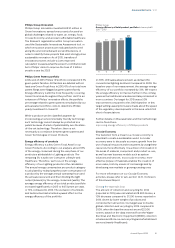
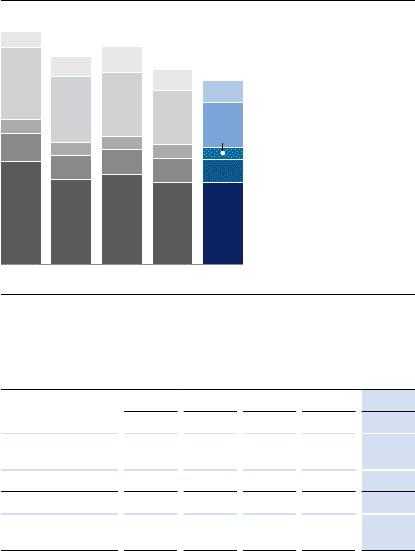
Philips Group
Operational carbon footprint in kilotonnes CO2-equivalent
2011 - 2015
903
243
119
627
130
2,022
‘11
745
205
117
573
167
1,807
‘12
786
218
116
558
220
1,898
‘13
720
204
122
475
176
1,697
‘14
718 Logistics
202 Business travel
103
Non-industrial operations
394 Manufacturing
183 Discontinued operations
1,600
‘15
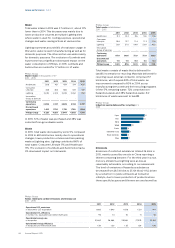
Philips Group
Operational carbon footprint by Greenhouse Gas Protocol
scopes in kilotonnes CO2-equivalent
2011 - 2015
2011 2012 2013 2014 2015
Scope 1 381 355 361 320 261
Scope 2 (market
based) 365 335 313 277 236
Scope 3 1,146 950 1,004 924 920
Philips Group 1,892 1,640 1,678 1,521 1,417
Scope 2 (location
based) 579 584 583 546 496