Philips 2015 Annual Report Download - page 186
Download and view the complete annual report
Please find page 186 of the 2015 Philips annual report below. You can navigate through the pages in the report by either clicking on the pages listed below, or by using the keyword search tool below to find specific information within the annual report.-
 1
1 -
2
-
3
-
4
-
5
-
6
-
7
-
8
-
9
-
10
-
11
-
12
-
13
-
14
-
15
-
16
-
17
-
18
-
19
-
20
-
21
-
22
-
23
-
24
-
25
-
26
-
27
-
28
-
29
-
30
-
31
-
32
-
33
-
34
-
35
-
36
-
37
-
38
-
39
-
40
-
41
-
42
-
43
-
44
-
45
-
46
-
47
-
48
-
49
-
50
-
51
-
52
-
53
-
54
-
55
-
56
-
57
-
58
-
59
-
60
-
61
-
62
-
63
-
64
-
65
-
66
-
67
-
68
-
69
-
70
-
71
-
72
-
73
-
74
-
75
-
76
-
77
-
78
-
79
-
80
-
81
-
82
-
83
-
84
-
85
-
86
-
87
-
88
-
89
-
90
-
91
-
92
-
93
-
94
-
95
-
96
-
97
-
98
-
99
-
100
-
101
-
102
-
103
-
104
-
105
-
106
-
107
-
108
-
109
-
110
-
111
-
112
-
113
-
114
-
115
-
116
-
117
-
118
-
119
-
120
-
121
-
122
-
123
-
124
-
125
-
126
-
127
-
128
-
129
-
130
-
131
-
132
-
133
-
134
-
135
-
136
-
137
-
138
-
139
-
140
-
141
-
142
-
143
-
144
-
145
-
146
-
147
-
148
-
149
-
150
-
151
-
152
-
153
-
154
-
155
-
156
-
157
-
158
-
159
-
160
-
161
-
162
-
163
-
164
-
165
-
166
-
167
-
168
-
169
-
170
-
171
-
172
-
173
-
174
-
175
-
 176
176 -
 177
177 -
 178
178 -
 179
179 -
 180
180 -
 181
181 -
 182
182 -
 183
183 -
 184
184 -
 185
185 -
 186
186 -
 187
187 -
 188
188 -
 189
189 -
 190
190 -
 191
191 -
 192
192 -
 193
193 -
 194
194 -
 195
195 -
 196
196 -
197
-
198
-
199
-
200
-
201
-
202
-
203
-
204
-
205
-
206
-
207
-
208
-
209
-
210
-
211
-
212
-
213
-
214
-
215
-
216
-
217
-
218
-
219
-
220
-
221
-
222
-
223
-
224
-
225
-
226
-
227
-
228
-
229
-
230
-
231
-
232
-
233
-
234
-
235
-
236
-
237
-
238
 |
 |

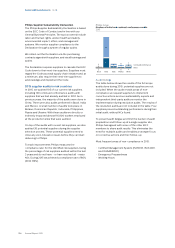
Sustainability statements 14
186 Annual Report 2015
Reference1)
Governance Boundaries
- Business ethics and General Business
Principles
section 7.5, Compliance risks, of this Annual Report
sub-section 5.2.7, General Business Principles , of this
Annual Report
Supply chain, operations, use phase
- Partnerships and co-creation sub-section 6.4.1, About Innovation, Group & Services in
2015, of this Annual Report
chapter 14, Sustainability statements, of this Annual Report
Supply chain, use phase
- Metrics beyond nancials section 5.2, Social performance, of this Annual Report
section 5.3, Environmental performance, of this Annual
Report
chapter 14, Sustainability statements, of this Annual Report
Supply chain, operations, use phase
- Product responsibility and regulation section 7.5, Compliance risks, of this Annual Report
sub-section 6.1.2, About Healthcare in 2015, of this Annual
Report
sub-section 6.2.2, About Consumer Lifestyle in 2015, of this
Annual Report
sub-section 6.3.2, About Lighting in 2015, of this Annual
Report
Supply chain, operations, use phase
1) With the exception of section 5.2, Social performance, of this Annual Report, section 5.3, Environmental performance, of this Annual Report, and chapter 14,
Sustainability statements, of this Annual Report, the sections and chapters referred to are not included in the scope of the assurance engagement
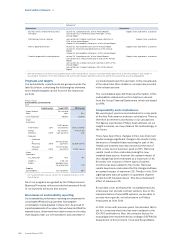
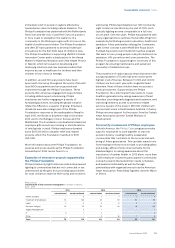
Programs and targets
Our sustainability commitments are grouped under the
label EcoVision, comprising the following key elements,
more detailed targets can be found in the respective
sections.
Philips Group
Sustainability commitments
2015
baseline year target 2015 2015 actual
Green Product
Sales
50% of total
sales 54%
Lives Improved 2 billion 2 billion
Green
Innovation
- Investments 2010
EUR 2 billion
(cumulative) EUR 2.2 billion
- Energy
Eciency 2009
50.3 lumen/
watt (up 50%)
44.5 lumen/
watt
- Materials
- Collection
&
Recycling 2009
45,000 tonnes
(up 100%) 28,500 tonnes
- Recycled
content 2009
15,000 tonnes
(up 100%) 13,500 tonnes
Green
Operations
- CO2 reduction 2007 40% 41%
- Health &
Safety
0.26 Lost
Workday Injury
Cases per year 0.21
Supplier
Sustainability 1) 72% compliant 86%
1) For more information see sub-section 14.2.8, Supplier indicators, of this
Annual Report
All of our programs are guided by the Philips General
Business Principles, which provide the framework for all
of our business decisions and actions.
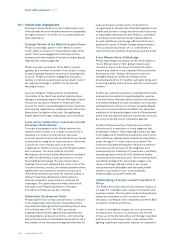
Boundaries of sustainability reporting
Our sustainability performance reporting encompasses the
consolidated Philips Group activities, following the
consolidation criteria detailed in this section. As a result of
impact assessments of our value chain we have identified the
material topics, determined their relative impact in the value
chain (supply chain, our own operations, and use phase of
our products) and report for each topic on the relevant parts
of the value chain. More details on our impact are provided
in the relevant sections.
The consolidated selected nancial information in this
sustainability statements section has been derived
from the Group Financial Statements, which are based
on IFRS.
Comparability and completeness
We used expert opinions and estimates for some parts
of the Key Performance Indicator calculations. There is
therefore an inherent uncertainty in our calculations.
The gures reported are Philips’ best estimate. As our
insight increases, we may enhance the methodology in
the future.
There have been three changes in the Lives Improved
model causing a signicant change in the results. Firstly,
the source of installed base reporting for part of the
Healthcare business was discontinued at the end of
2014, a new source has been used in 2015. Historical
results could not be recalculated using the new
installed base source, however the upward impact of
this change has been estimated at a maximum of 4%.
Secondly, the inclusion of three types of patient
monitors has been added to the model. Historical
results have been recalculated for this change and have
an upward impact of maximum 2%. Thirdly, in the 2014
Lighting sales data an update on quantities of green
products sold has taken place. This has a downward
eect of maximum 4%.
Social data cover all employees, including temporary
employees, but exclude contract workers. Due to the
implementation of new HRM systems, we are able to
provide more specic exit information on Philips
employees as from 2014.
In 2015, in line with previous years, the emission factor
set for consumed electricity has been updated to the
IEA 2015 publications. Also, the emission factors for
natural gas were implemented according to DEFRA (UK
Department of Environment, Food and Rural Aairs).