Philips 2015 Annual Report Download - page 150
Download and view the complete annual report
Please find page 150 of the 2015 Philips annual report below. You can navigate through the pages in the report by either clicking on the pages listed below, or by using the keyword search tool below to find specific information within the annual report.-
 1
1 -
2
-
3
-
4
-
5
-
6
-
7
-
8
-
9
-
10
-
11
-
12
-
13
-
14
-
15
-
16
-
17
-
18
-
19
-
20
-
21
-
22
-
23
-
24
-
25
-
26
-
27
-
28
-
29
-
30
-
31
-
32
-
33
-
34
-
35
-
36
-
37
-
38
-
39
-
40
-
41
-
42
-
43
-
44
-
45
-
46
-
47
-
48
-
49
-
50
-
51
-
52
-
53
-
54
-
55
-
56
-
57
-
58
-
59
-
60
-
61
-
62
-
63
-
64
-
65
-
66
-
67
-
68
-
69
-
70
-
71
-
72
-
73
-
74
-
75
-
76
-
77
-
78
-
79
-
80
-
81
-
82
-
83
-
84
-
85
-
86
-
87
-
88
-
89
-
90
-
91
-
92
-
93
-
94
-
95
-
96
-
97
-
98
-
99
-
100
-
101
-
102
-
103
-
104
-
105
-
106
-
107
-
108
-
109
-
110
-
111
-
112
-
113
-
114
-
115
-
116
-
117
-
118
-
119
-
120
-
121
-
122
-
123
-
124
-
125
-
126
-
127
-
128
-
129
-
130
-
131
-
132
-
133
-
134
-
135
-
136
-
137
-
138
-
139
-
 140
140 -
 141
141 -
 142
142 -
 143
143 -
 144
144 -
 145
145 -
 146
146 -
 147
147 -
 148
148 -
 149
149 -
 150
150 -
 151
151 -
 152
152 -
 153
153 -
 154
154 -
 155
155 -
 156
156 -
 157
157 -
 158
158 -
 159
159 -
 160
160 -
161
-
162
-
163
-
164
-
165
-
166
-
167
-
168
-
169
-
170
-
171
-
172
-
173
-
174
-
175
-
176
-
177
-
178
-
179
-
180
-
181
-
182
-
183
-
184
-
185
-
186
-
187
-
188
-
189
-
190
-
191
-
192
-
193
-
194
-
195
-
196
-
197
-
198
-
199
-
200
-
201
-
202
-
203
-
204
-
205
-
206
-
207
-
208
-
209
-
210
-
211
-
212
-
213
-
214
-
215
-
216
-
217
-
218
-
219
-
220
-
221
-
222
-
223
-
224
-
225
-
226
-
227
-
228
-
229
-
230
-
231
-
232
-
233
-
234
-
235
-
236
-
237
-
238
 |
 |
Group nancial statements 12.9
150 Annual Report 2015
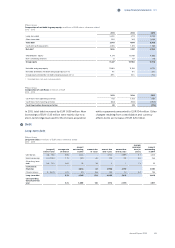
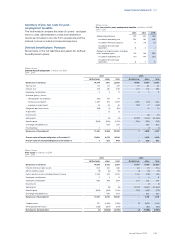
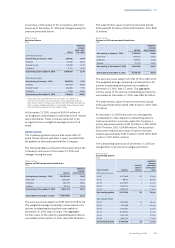
The classication of the net balance is as follows:
Philips Group
Net balance of dened-benet pension plans in millions of EUR
2014 - 2015
2014 2015
Netherlands other total Netherlands other total
Prepaid pension costs under other non-current assets - 2 2 - 3 3
Accrued pension costs under other liabilities - (1,072) (1,072) - (1,018) (1,018)
Provision for pensions under provisions (7) (926) (933) (7) (885) (892)
Provision in assets held for sale - (7) (7) - - -
Net balance of dened-benet plans (7) (2,003) (2,010) (7) (1,900) (1,907)
Philips Group
Changes in the eect of the asset ceiling in millions of EUR
2014 - 2015
2014 2015
Netherlands other total Netherlands other total
Balance as of January 1 555 428 983 238 554 792
Interest on unrecognized assets 19 28 47 2 27 29
Remeasurements (336) 73 (263) (240) (493) (733)
Exchange rate dierences - 25 25 - 2 2
Balance as of December 31 238 554 792 - 90 90
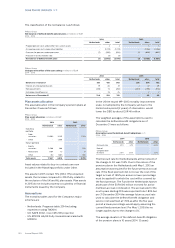
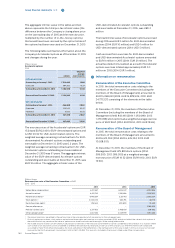
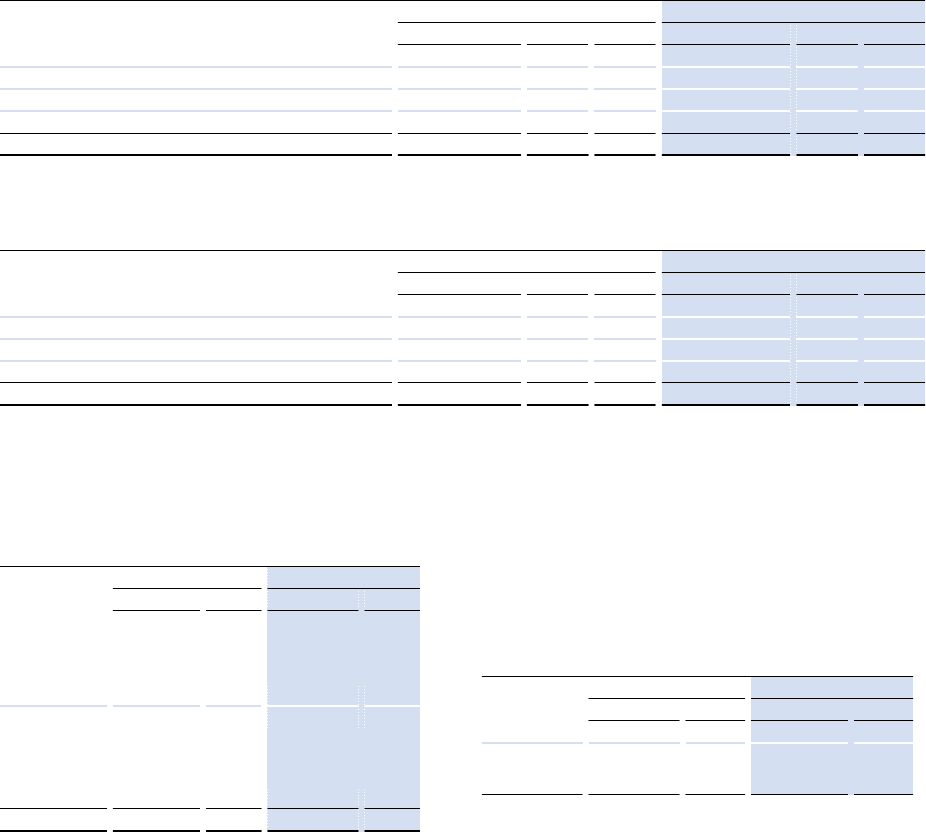
Plan assets allocation
The asset allocation in the Company’s pension plans at
December 31 was as follows:
Philips Group
Plan assets allocation in millions of EUR
2014 - 2015
2014 2015
Netherlands other Netherlands other
Matching
portfolio:
- Debt
securities 10,663 5,051 1,523
- Other - 1,299
Return portfolio:
- Equity
securities 5,088 388 740
- Real estate 1,784 13 9
- Other 312 1,265 438
Total assets 17,847 8,016 2,710
Asset values related to buy-in contracts are now
included in the Matching portfolio under Other.
The assets in 2015 contain 51% (2014: 17%) unquoted
assets, the increase compared to 2014 fully related to
the exclusion of the UK and NL plan assets. Plan assets
in 2015 do not include property occupied by or nancial
instruments issued by the Company.
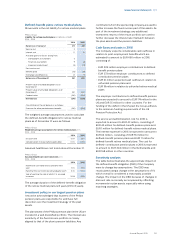
Assumptions
The mortality tables used for the Company’s major
schemes are:
• Netherlands: Prognosis table 2014 including
experience rating TW2014.
• UK: SAPS 2002- Core CMI 2011 projection
• US: RP2014 HA/EE Fully Generational scaled with
MP2014
In the US the issued MP-2015 mortality improvement
scale, not adopted by the Company yet due to the
limited extra period (2 years) of observation, would
lower the DBO by about EUR 40 million.
The weighted averages of the assumptions used to
calculate the dened-benet obligations as of
December 31 were as follows:
Philips Group
Assumptions used for dened-benet obligations in %
2014 - 2015
2014 2015
Netherlands other Netherlands other
Discount rate 2.1% 3.7% - 4.0%
Rate of
compensation
increase 2.0% 3.0% - 2.7%
The Discount rate for the Netherlands at the moment of
the change to DC was 1.55%. Due to the nature of the
pension plan in the Netherlands until May 1, 2015 an
assumption was required for the future pension accrual
rate. If the xed premium did not cover the cost of the
target accrual of 1.85% per annum a lower percentage
must be applied for which the cost will be covered by
the xed premium. The Fund in the Netherlands has set
aside part of the EUR 600 million received for active
members accrual or indexation. The accrual rate for the
next 5 years starting 2015 was expected to be 1.85% but
per 31 December 2014 the average future accrual rate
used to calculate the dened-benet obligation and
service cost was xed at 1.74% as after the ve year
period a lower percentage would apply assuming the
current xed premium level. Per May 1, 2015 this no
longer applies due to the change to DC.
The average duration of the dened-benet obligation
of the pension plans is 10 years (2014: 12 years).