Philips 2015 Annual Report Download - page 42
Download and view the complete annual report
Please find page 42 of the 2015 Philips annual report below. You can navigate through the pages in the report by either clicking on the pages listed below, or by using the keyword search tool below to find specific information within the annual report.-
 1
1 -
2
-
3
-
4
-
5
-
6
-
7
-
8
-
9
-
10
-
11
-
12
-
13
-
14
-
15
-
16
-
17
-
18
-
19
-
20
-
21
-
22
-
23
-
24
-
25
-
26
-
27
-
28
-
29
-
30
-
31
-
 32
32 -
 33
33 -
 34
34 -
 35
35 -
 36
36 -
 37
37 -
 38
38 -
 39
39 -
 40
40 -
 41
41 -
 42
42 -
 43
43 -
 44
44 -
 45
45 -
 46
46 -
 47
47 -
 48
48 -
 49
49 -
 50
50 -
 51
51 -
 52
52 -
53
-
54
-
55
-
56
-
57
-
58
-
59
-
60
-
61
-
62
-
63
-
64
-
65
-
66
-
67
-
68
-
69
-
70
-
71
-
72
-
73
-
74
-
75
-
76
-
77
-
78
-
79
-
80
-
81
-
82
-
83
-
84
-
85
-
86
-
87
-
88
-
89
-
90
-
91
-
92
-
93
-
94
-
95
-
96
-
97
-
98
-
99
-
100
-
101
-
102
-
103
-
104
-
105
-
106
-
107
-
108
-
109
-
110
-
111
-
112
-
113
-
114
-
115
-
116
-
117
-
118
-
119
-
120
-
121
-
122
-
123
-
124
-
125
-
126
-
127
-
128
-
129
-
130
-
131
-
132
-
133
-
134
-
135
-
136
-
137
-
138
-
139
-
140
-
141
-
142
-
143
-
144
-
145
-
146
-
147
-
148
-
149
-
150
-
151
-
152
-
153
-
154
-
155
-
156
-
157
-
158
-
159
-
160
-
161
-
162
-
163
-
164
-
165
-
166
-
167
-
168
-
169
-
170
-
171
-
172
-
173
-
174
-
175
-
176
-
177
-
178
-
179
-
180
-
181
-
182
-
183
-
184
-
185
-
186
-
187
-
188
-
189
-
190
-
191
-
192
-
193
-
194
-
195
-
196
-
197
-
198
-
199
-
200
-
201
-
202
-
203
-
204
-
205
-
206
-
207
-
208
-
209
-
210
-
211
-
212
-
213
-
214
-
215
-
216
-
217
-
218
-
219
-
220
-
221
-
222
-
223
-
224
-
225
-
226
-
227
-
228
-
229
-
230
-
231
-
232
-
233
-
234
-
235
-
236
-
237
-
238
 |
 |
Group performance 5.3.1
42 Annual Report 2015
Recycled materials
We calculated the amount of recycled materials used in
our products in 2015 at some 13,500 tonnes (2014:
13,000 tonnes) by focusing on the material streams
plastics (Consumer Lifestyle), aluminum (Lighting),
refurbished products, and spare parts harvesting
(Healthcare) depending on their relevance in each
sector.
Our target was to double the amount of recycled
materials in our products by 2015 compared to 2009,
when the baseline was set at 7,500 tonnes.
Further details on this parameter and the methodology
can be found here: Closing the materials loop.
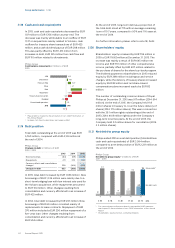
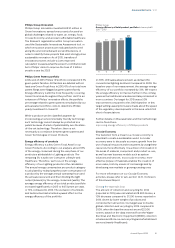
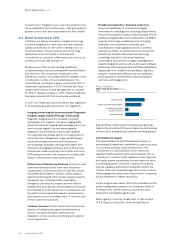
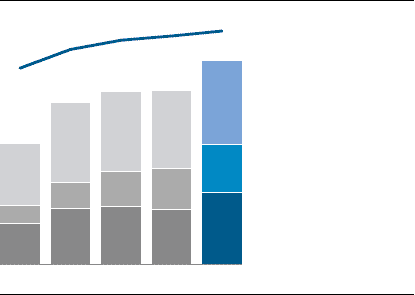
5.3.2 Green Product sales
Green Products oer a signicant environmental
improvement in one or more Green Focal Areas: Energy
eciency, Packaging, Hazardous substances, Weight,
Recycling and disposal, and Lifetime reliability. Sales
from Green Products, excluding the Lumileds and
Automotive business, increased to EUR 13.0 billion in
2015, or 54% of sales (52% in 2014), thereby reaching a
record level for Philips.
The exclusion of Lumileds and Automotive had a 1%
negative impact on the total Green Product sales
percentage.
Philips Group
Green Product sales per sector in millions of EUR
2011 - 2015
2,663
1,101
3,955
7,719
‘11
3,610
1,619
5,056
10,285
‘12
3,690
2,270
5,037
10,997
‘13
3,508
2,605
4,952
11,065
‘14
4,580 Healthcare
3,091 Consumer Lifestyle
5,343 Lighting
13,014
‘15
38.8%
46.3% 50.0% 51.7% 53.7% As a % of sales
We aim to create products that have signicantly less
impact on the environment during their whole lifecycle
through our EcoDesign process. Overall, the most
signicant improvements have been realized in our
energy eciency Green Focal Area, an important
objective of our EcoVision program, although there was
also growing attention for hazardous substances and
recyclability in all sectors in 2015, the latter driven by
our Circular Economy initiatives.
New Green Products from each sector include the
following examples.
Healthcare
In 2015, Healthcare expanded the Green Product
portfolio with 11 new products and redesigned various
current Green Products with environmental
improvements. These products improve patient
outcomes, provide better value, and help secure access
to high-quality care, while reducing environmental
impact. Examples include a new packaging system for
our PCMS medical supplies business, which has
enabled a 90% reduction in air space in packaging and
a 24% reduction in packaging material weight to
support our customers in reducing their waste streams.
Another example is our Home Monitoring business
which operates by a performance-based service
business model that enables 76% re-use of products
and parts while maintaining the embedded labor and
energy. The Ecia is a new Green Product in our value
range of patient monitoring, which is an example of
how we aim to support expanded access to care in
under-resourced regions while lowering environmental
impact as well. We started to add an energy-ecient
CryoCompressor to our MRI systems, with energy
savings in the various non-scanning modes of 30-40%.
Both material (30%) and energy (20%) savings are
achieved in our new Access CT system, a compact-
designed CT for the value segment market. Sleep and
Respiratory Care (SRC) launched the V680 ventilator
which includes, besides better performance in
uninterrupted invasive or noninvasive ventilation, a
product and packaging material weight reduction of
60% and 75% respectively and a reduction in energy
usage of 80%. Other new Green Products came from
SRC (lightweight masks and sleep therapy devices),
MCS group (lightweight battery chargers) and X-Ray
systems for the Brazilian market without lead counter
ballasts.
Consumer Lifestyle
Consumer Lifestyle focuses on Green Products which
meet or exceed our minimum requirements in the areas
of energy consumption, packaging, and substances of
concern. The sales of Green Products in 2015 surpassed
58% of total sales. All our Green Products with
rechargeable batteries (like toothbrushes, shavers, and
grooming products) exceed the stringent California
energy eciency norm by at least 10%. We are making
steady progress in developing PVC/BFR-free products.
More than 65% of sales consist of PVC/BFR-free
products, with the exception of the power cords, for
which there are not yet economical viable alternatives
available. In the remaining 35% of product sales,
PVC/BFR has already been phased out to a signicant
extent, but the products are not yet completely free of
these substances.
In 2015, more kitchen appliances, vacuum cleaners,
coee machines and irons were launched with parts
made of recycled plastics. In total we have applied
some 900 tons of recycled plastics in our products. An
example is the new Perfect Care Eco Aqua Steam
Generator, with more than 50% recycled plastics.