Philips 2015 Annual Report Download - page 30
Download and view the complete annual report
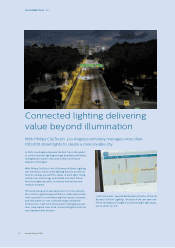
Please find page 30 of the 2015 Philips annual report below. You can navigate through the pages in the report by either clicking on the pages listed below, or by using the keyword search tool below to find specific information within the annual report.-
 1
1 -
2
-
3
-
4
-
5
-
6
-
7
-
8
-
9
-
10
-
11
-
12
-
13
-
14
-
15
-
16
-
17
-
18
-
19
-
 20
20 -
 21
21 -
 22
22 -
 23
23 -
 24
24 -
 25
25 -
 26
26 -
 27
27 -
 28
28 -
 29
29 -
 30
30 -
 31
31 -
 32
32 -
 33
33 -
 34
34 -
 35
35 -
 36
36 -
 37
37 -
 38
38 -
 39
39 -
 40
40 -
41
-
42
-
43
-
44
-
45
-
46
-
47
-
48
-
49
-
50
-
51
-
52
-
53
-
54
-
55
-
56
-
57
-
58
-
59
-
60
-
61
-
62
-
63
-
64
-
65
-
66
-
67
-
68
-
69
-
70
-
71
-
72
-
73
-
74
-
75
-
76
-
77
-
78
-
79
-
80
-
81
-
82
-
83
-
84
-
85
-
86
-
87
-
88
-
89
-
90
-
91
-
92
-
93
-
94
-
95
-
96
-
97
-
98
-
99
-
100
-
101
-
102
-
103
-
104
-
105
-
106
-
107
-
108
-
109
-
110
-
111
-
112
-
113
-
114
-
115
-
116
-
117
-
118
-
119
-
120
-
121
-
122
-
123
-
124
-
125
-
126
-
127
-
128
-
129
-
130
-
131
-
132
-
133
-
134
-
135
-
136
-
137
-
138
-
139
-
140
-
141
-
142
-
143
-
144
-
145
-
146
-
147
-
148
-
149
-
150
-
151
-
152
-
153
-
154
-
155
-
156
-
157
-
158
-
159
-
160
-
161
-
162
-
163
-
164
-
165
-
166
-
167
-
168
-
169
-
170
-
171
-
172
-
173
-
174
-
175
-
176
-
177
-
178
-
179
-
180
-
181
-
182
-
183
-
184
-
185
-
186
-
187
-
188
-
189
-
190
-
191
-
192
-
193
-
194
-
195
-
196
-
197
-
198
-
199
-
200
-
201
-
202
-
203
-
204
-
205
-
206
-
207
-
208
-
209
-
210
-
211
-
212
-
213
-
214
-
215
-
216
-
217
-
218
-
219
-
220
-
221
-
222
-
223
-
224
-
225
-
226
-
227
-
228
-
229
-
230
-
231
-
232
-
233
-
234
-
235
-
236
-
237
-
238
 |
 |
Group performance 5.1.15
30 Annual Report 2015
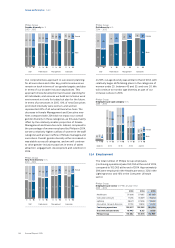
Philips Group
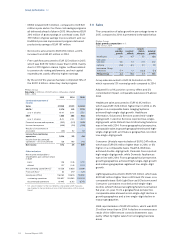
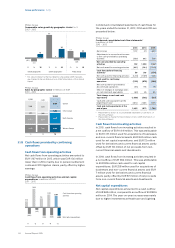
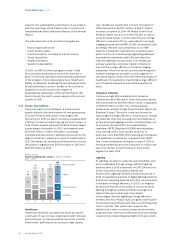
Comparable sales growth by geographic cluster1) in %
2013 - 2015
(0.3)
‘13
(1.3)
‘14
1.5
‘15
mature geographies
8.9
‘13
0
‘14
3.5
‘15
growth geographies
2.7
‘13
(0.9)
‘14
2.2
‘15
Philips Group
1) For a reconciliation to the most directly comparable GAAP measures,
see chapter 15, Reconciliation of non-GAAP information, of this Annual
Report
Philips Group
Sales by geographic cluster in millions of EUR
2013 - 2015
5,680
6,883
1,759
7,668
21,990
‘13
5,665
6,678
1,661
7,387
21,391
‘14
5,886 Western Europe
8,095 North America
1,855 Other mature
8,408 Growth
24,244
‘15
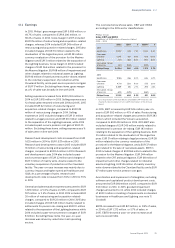
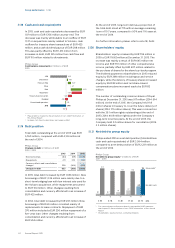
5.1.15 Cash ows provided by continuing
operations
Cash ows from operating activities
Net cash ows from operating activities amounted to
EUR 1,167 million in 2015, which was EUR 136 million
lower than in 2014, mainly due to pension settlement
costs and CRT litigation claims, partly oset by higher
earnings.
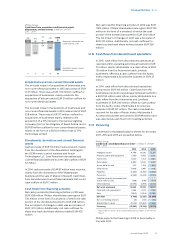
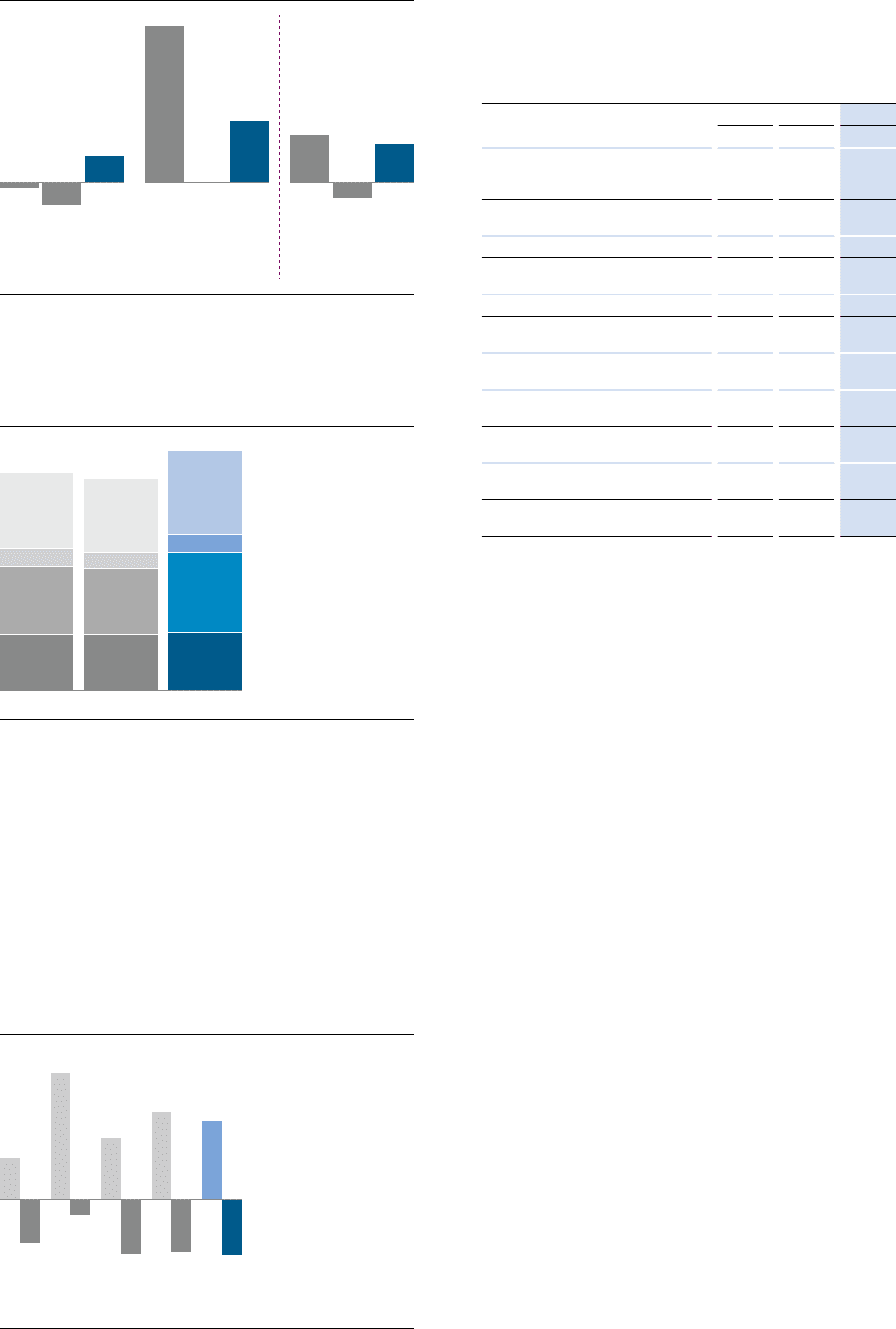
Philips Group
Cash ows from operating activities and net capital
expenditures in millions of EUR
2011 - 2015
610
(663)
‘11
1,886
(241)
‘12
912
(830)
‘13
1,303
(806)
‘14
1,167 Cash flows from operating
activities
(842) Net capital expenditures
‘15
Condensed consolidated statements of cash ows for
the years ended December 31, 2013, 2014 and 2015 are
presented below:
Philips Group
Condensed consolidated cash ow statements1)
in millions of EUR
2013 - 2015
2013 2014 2015
Net income 1,172 411 659
Adjustments to reconcile net income
to net cash provided by operating
activities (260) 892 508
Net cash provided by operating
activities 912 1,303 1,167
Net cash used for investing activities (862) (984) (1,941)
Cash ows before nancing
activities2) 50 319 (774)
Net cash used for nancing activities (1,241) (1,189) 508
Cash used for continuing
operations (1,191) (870) (266)
Net cash (used for) provided by
discontinued operations (115) 193 79
Eect of changes in exchange rates
on cash and cash equivalents (63) 85 80
Total change in cash and cash
equivalents (1,369) (592) (107)
Cash and cash equivalents at the
beginning of year 3,834 2,465 1,873
Cash and cash equivalents at the
end of year 2,465 1,873 1,766
1) Please refer to section 12.7, Consolidated statements of cash ows, of
this Annual Report
2) Please refer to chapter 15, Reconciliation of non-GAAP information, of
this Annual Report
Cash ows from investing activities
In 2015, cash ows from investing activities resulted in
a net outow of EUR 1,941 million. This was attributable
to EUR 1,137 million used for acquisitions of businesses
and non-current nancial assets, EUR 842 million cash
used for net capital expenditures, and EUR 72 million
used for derivatives and current nancial assets, partly
oset by EUR 110 million of net proceeds from non-
current nancial assets and divestments.
In 2014, cash ows from investing activities resulted in
a net outow of EUR 984 million. This was attributable
to EUR 806 million cash used for net capital
expenditures, EUR 258 million used for acquisitions of
businesses and non-current nancial assets, and EUR
7 million used for derivatives and current nancial
assets, partly oset by EUR 87 million of net proceeds
from non-current nancial assets and divestments.
Net capital expenditures
Net capital expenditures amounted to a cash outow
of EUR 842 million, compared to an outow of EUR 806
million in 2014. The year-on-year increase was mainly
due to higher investments at Healthcare and Lighting.