Philips 2015 Annual Report Download - page 110
Download and view the complete annual report
Please find page 110 of the 2015 Philips annual report below. You can navigate through the pages in the report by either clicking on the pages listed below, or by using the keyword search tool below to find specific information within the annual report.-
 1
1 -
2
-
3
-
4
-
5
-
6
-
7
-
8
-
9
-
10
-
11
-
12
-
13
-
14
-
15
-
16
-
17
-
18
-
19
-
20
-
21
-
22
-
23
-
24
-
25
-
26
-
27
-
28
-
29
-
30
-
31
-
32
-
33
-
34
-
35
-
36
-
37
-
38
-
39
-
40
-
41
-
42
-
43
-
44
-
45
-
46
-
47
-
48
-
49
-
50
-
51
-
52
-
53
-
54
-
55
-
56
-
57
-
58
-
59
-
60
-
61
-
62
-
63
-
64
-
65
-
66
-
67
-
68
-
69
-
70
-
71
-
72
-
73
-
74
-
75
-
76
-
77
-
78
-
79
-
80
-
81
-
82
-
83
-
84
-
85
-
86
-
87
-
88
-
89
-
90
-
91
-
92
-
93
-
94
-
95
-
96
-
97
-
98
-
99
-
 100
100 -
 101
101 -
 102
102 -
 103
103 -
 104
104 -
 105
105 -
 106
106 -
 107
107 -
 108
108 -
 109
109 -
 110
110 -
 111
111 -
 112
112 -
 113
113 -
 114
114 -
 115
115 -
 116
116 -
 117
117 -
 118
118 -
 119
119 -
 120
120 -
121
-
122
-
123
-
124
-
125
-
126
-
127
-
128
-
129
-
130
-
131
-
132
-
133
-
134
-
135
-
136
-
137
-
138
-
139
-
140
-
141
-
142
-
143
-
144
-
145
-
146
-
147
-
148
-
149
-
150
-
151
-
152
-
153
-
154
-
155
-
156
-
157
-
158
-
159
-
160
-
161
-
162
-
163
-
164
-
165
-
166
-
167
-
168
-
169
-
170
-
171
-
172
-
173
-
174
-
175
-
176
-
177
-
178
-
179
-
180
-
181
-
182
-
183
-
184
-
185
-
186
-
187
-
188
-
189
-
190
-
191
-
192
-
193
-
194
-
195
-
196
-
197
-
198
-
199
-
200
-
201
-
202
-
203
-
204
-
205
-
206
-
207
-
208
-
209
-
210
-
211
-
212
-
213
-
214
-
215
-
216
-
217
-
218
-
219
-
220
-
221
-
222
-
223
-
224
-
225
-
226
-
227
-
228
-
229
-
230
-
231
-
232
-
233
-
234
-
235
-
236
-
237
-
238
 |
 |

Group nancial statements 12.7
110 Annual Report 2015
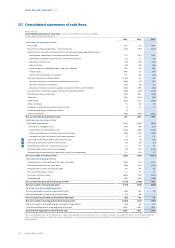
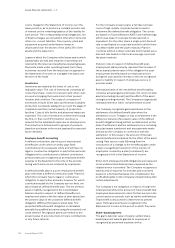
12.7 Consolidated statements of cash ows
Philips Group
Consolidated statements of cash ows in millions of EUR unless otherwise stated
For the years ended December 31
2013 2014 2015
Cash ows from operating activities
Net income 1,172 411 659
Result of discontinued operations - net of income tax (138) (190) (245)
Adjustments to reconcile net income (loss) to net cash provided by operating activities:
Depreciation, amortization, and impairments of xed assets 1,177 1,187 1,281
Impairment of goodwill and other non-current nancial assets 38 21 48
Net gain on sale of assets (54) (83) (110)
Interest income (54) (39) (48)
Interest expense on debt, borrowings and other liabilities 258 231 278
Income taxes 466 26 239
Results from investments in associates 25 (62) (10)
Decrease (Increase) in working capital (1,167) 312 67
Decrease (Increase) in receivables and other current assets (486) (75) 161
Decrease (Increase) in inventories (165) (77) 22
(Decrease) increase in accounts payable, accrued and other current liabilities (516) 464 (116)
Increase in non-current receivables, other assets and other liabilities (264) (412) (135)
(Decrease) increase in provisions (194) 640 (278)
Other items 299 (242) (99)
Interest paid (267) (232) (265)
Interest received 52 38 48
Dividends received from investments in associates 6 41 17
Dividends paid to non-controlling interests (7) - -
Income taxes paid (436) (344) (280)
Net cash provided by operating activities 912 1,303 1,167
Cash ows from investing activities
Net capital expenditures (830) (806) (842)
Purchase of intangible assets (49) (114) (121)
Expenditures on development assets (326) (295) (314)
Capital expenditures on property, plant and equipment (482) (437) (522)
Proceeds from sales of property, plant and equipment 27 40 115
23 Cash used for derivatives and current nancial assets (101) (7) (72)
24 Purchase of other non-current nancial assets (13) (81) (21)
24 Proceeds from other non-current nancial assets 14 107 53
Purchase of businesses, net of cash acquired (11) (177) (1,116)
Proceeds from sale of interests in businesses, net of cash disposed of 79 (20) 57
Net cash used for investing activities (862) (984) (1,941)
Cash ows from nancing activities
Proceeds from issuance (payments) of short-term debt (285) (37) 1,241
Principal payments on long-term debt (186) (333) (104)
Proceeds from issuance of long-term debt 64 69 94
Re-issuance of treasury shares 107 117 81
Purchase of treasury shares (669) (713) (506)
Dividends paid (272) (292) (298)
Net cash provided by (used for) nancing activities (1,241) (1,189) 508
Net cash used for continuing operations (1,191) (870) (266)
Cash ows from discontinued operations
Net cash provided by (used for) operating activities (68) 105 79
Net cash provided by (used for) investing activities (47) 88 -
Net cash (used for) provided by discontinued operations (115) 193 79
Net cash used for continuing and discontinued operations (1,306) (677) (187)
Eect of changes in exchange rates on cash and cash equivalents (63) 85 80
Cash and cash equivalents at the beginning of the year 3,834 2,465 1,873
Cash and cash equivalents at the end of the year 2,465 1,873 1,766
The accompanying notes are an integral part of these consolidated nancial statements. For a number of reasons, principally the eects of translation dierences
and consolidation changes, certain items in the statements of cash ows do not correspond to the dierences between the balance sheet amounts for the
respective items.