Philips 2015 Annual Report Download - page 129
Download and view the complete annual report
Please find page 129 of the 2015 Philips annual report below. You can navigate through the pages in the report by either clicking on the pages listed below, or by using the keyword search tool below to find specific information within the annual report.-
 1
1 -
2
-
3
-
4
-
5
-
6
-
7
-
8
-
9
-
10
-
11
-
12
-
13
-
14
-
15
-
16
-
17
-
18
-
19
-
20
-
21
-
22
-
23
-
24
-
25
-
26
-
27
-
28
-
29
-
30
-
31
-
32
-
33
-
34
-
35
-
36
-
37
-
38
-
39
-
40
-
41
-
42
-
43
-
44
-
45
-
46
-
47
-
48
-
49
-
50
-
51
-
52
-
53
-
54
-
55
-
56
-
57
-
58
-
59
-
60
-
61
-
62
-
63
-
64
-
65
-
66
-
67
-
68
-
69
-
70
-
71
-
72
-
73
-
74
-
75
-
76
-
77
-
78
-
79
-
80
-
81
-
82
-
83
-
84
-
85
-
86
-
87
-
88
-
89
-
90
-
91
-
92
-
93
-
94
-
95
-
96
-
97
-
98
-
99
-
100
-
101
-
102
-
103
-
104
-
105
-
106
-
107
-
108
-
109
-
110
-
111
-
112
-
113
-
114
-
115
-
116
-
117
-
118
-
 119
119 -
 120
120 -
 121
121 -
 122
122 -
 123
123 -
 124
124 -
 125
125 -
 126
126 -
 127
127 -
 128
128 -
 129
129 -
 130
130 -
 131
131 -
 132
132 -
 133
133 -
 134
134 -
 135
135 -
 136
136 -
 137
137 -
 138
138 -
 139
139 -
140
-
141
-
142
-
143
-
144
-
145
-
146
-
147
-
148
-
149
-
150
-
151
-
152
-
153
-
154
-
155
-
156
-
157
-
158
-
159
-
160
-
161
-
162
-
163
-
164
-
165
-
166
-
167
-
168
-
169
-
170
-
171
-
172
-
173
-
174
-
175
-
176
-
177
-
178
-
179
-
180
-
181
-
182
-
183
-
184
-
185
-
186
-
187
-
188
-
189
-
190
-
191
-
192
-
193
-
194
-
195
-
196
-
197
-
198
-
199
-
200
-
201
-
202
-
203
-
204
-
205
-
206
-
207
-
208
-
209
-
210
-
211
-
212
-
213
-
214
-
215
-
216
-
217
-
218
-
219
-
220
-
221
-
222
-
223
-
224
-
225
-
226
-
227
-
228
-
229
-
230
-
231
-
232
-
233
-
234
-
235
-
236
-
237
-
238
 |
 |
Group nancial statements 12.9
Annual Report 2015 129
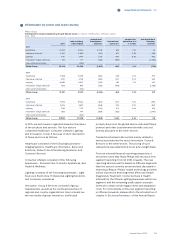
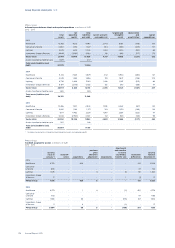
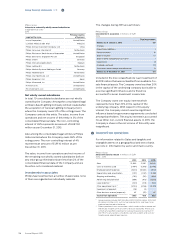
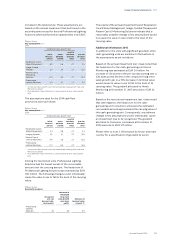
Sales composition
Philips Group
Sales composition in millions of EUR
2013 - 2015
2013 2014 2015
Goods 18,398 17,972 20,659
Services 3,130 2,948 3,080
Royalties 462 471 505
Sales 21,990 21,391 24,244
Philips has no single external customer that represents
10% or more of sales.
Costs of materials used
Cost of materials used represents the inventory
recognized in cost of sales.
Employee benet expenses
Philips Group
Employee benet expenses in millions of EUR
2013 - 2015
2013 2014 2015
Salaries and wages 4,722 5,018 5,533
Post-employment benets costs 354 326 780
Other social security and similar
charges:
- Required by law 621 623 664
- Voluntary 117 113 130
Employee benet expenses 5,814 6,080 7,107
The employee benet expense relate to employees
who are working on the payroll of Philips, both with
permanent and temporary contracts.
For further information on post-employment benet
costs, see note 20, Post-employment benets.
For details on the remuneration of the members of the
Board of Management and the Supervisory Board, see
note 29, Information on remuneration.
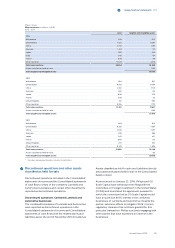
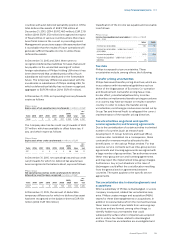
Employees
The average number of employees by category is
summarized as follows:
Philips Group
Employees in FTEs
2013 - 2015
2013 2014 2015
Production 50,628 48,110 46,869
Research and development 11,757 11,714 11,462
Other 31,673 32,684 34,011
Employees 94,058 92,508 92,342
3rd party workers 12,194 12,562 13,314
Continuing operations 106,252 105,070 105,656
Discontinued operations 10,792 9,222 8,556
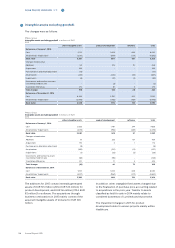
Employees consist of those persons working on the
payroll of Philips and whose costs are reected in the
Employee benet expenses table. 3rd party workers
consist of personnel hired on a per-period basis, via
external companies.
Depreciation and amortization
Depreciation of property, plant and equipment and
amortization of intangible assets, including
impairments, are as follows:
Philips Group
Depreciation and amortization1) in millions of EUR
2013 - 2015
2013 2014 2015
Depreciation of property, plant and
equipment 521 592 582
Amortization of software 39 32 48
Amortization of other intangible assets 393 332 380
Amortization of development costs 224 231 271
Depreciation and amortization 1,177 1,187 1,281
1) Includes impairments
Depreciation of property, plant and equipment is
primarily included in cost of sales. Amortization of the
categories of other intangible assets are reported in
selling expenses for brand names and customer
relationships and are reported in cost of sales for
technology based and other intangible assets.
Amortization of development cost is included in
research and development expenses.
Shipping and handling
Shipping and handling costs are included in cost of
sales and selling expenses.
Advertising and promotion
Advertising and promotion costs are included in selling
expenses.
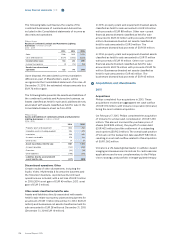
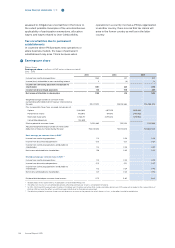
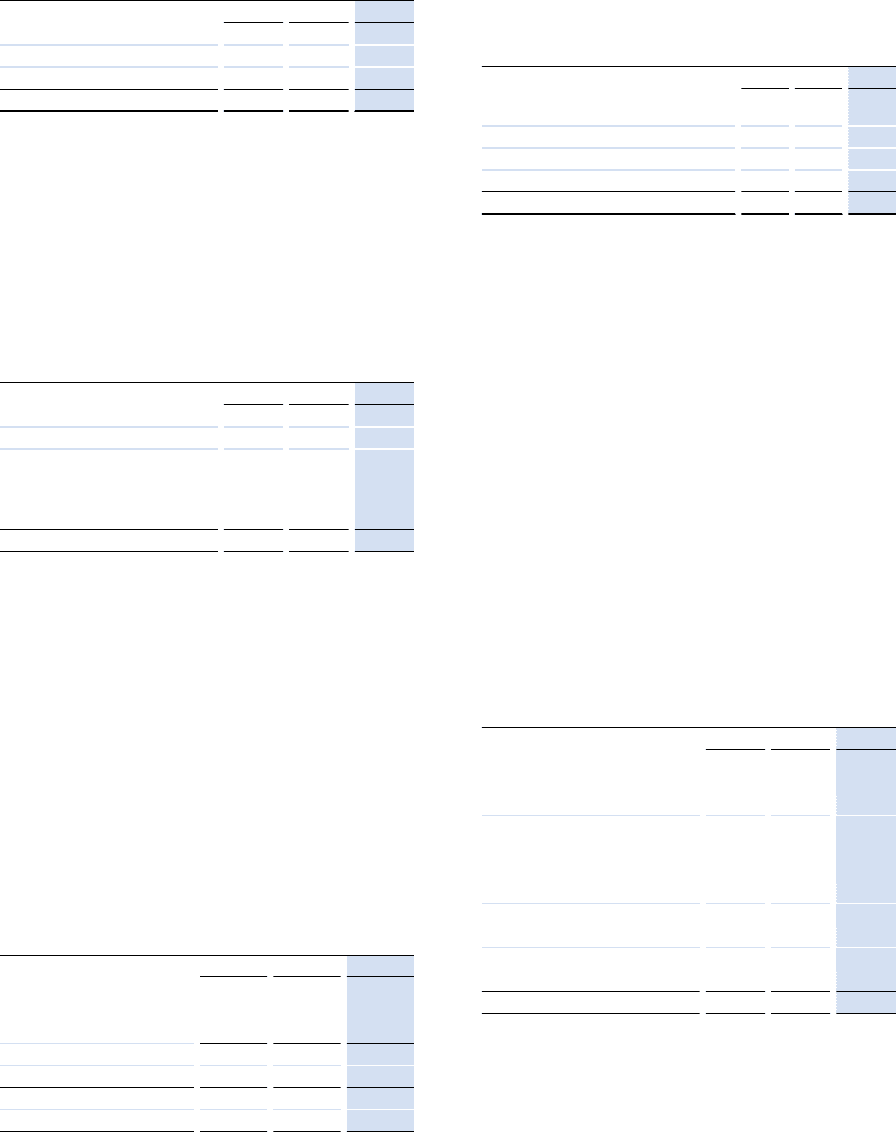
Audit fees
Philips Group
Fees KPMG in millions of EUR
2013 - 2015
2013 2014 2015
Audit fees 15.6 14.9 15.3
- consolidated nancial statements 10.1 9.6 9.8
- statutory nancial statements 5.5 5.3 5.5
Audit-related fees 1) 2.2 3.9 4.9
- acquisitions and divestments 0.4 2.4 3.6
- sustainability assurance 0.7 0.6 0.6
- other 1.1 0.9 0.7
Tax fees 2) 0.8 0.2 1.1
- tax compliance services 0.8 0.2 1.1
Other fees 1.3 0.0 0.0
- other 1.3 0.0 0.0
Fees KPMG 19.9 19.0 21.3
1) The percentage of audit-related fees in 2015 is 23.0% of the total fees
2) The percentage of tax fees in 2015 is 5.2% of the total fees
This table ’Fees KPMG’ forms an integral part of the
Company Financial Statements, please refer to note B,
Audit fees.
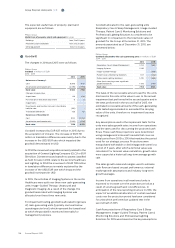
Impairment of goodwill
In 2014, goodwill impairment charges amount to EUR 3
million consisting of impairments on divested
businesses in Healthcare and Lighting. In 2013, goodwill