Philips 2015 Annual Report Download - page 222
Download and view the complete annual report
Please find page 222 of the 2015 Philips annual report below. You can navigate through the pages in the report by either clicking on the pages listed below, or by using the keyword search tool below to find specific information within the annual report.-
 1
1 -
2
-
3
-
4
-
5
-
6
-
7
-
8
-
9
-
10
-
11
-
12
-
13
-
14
-
15
-
16
-
17
-
18
-
19
-
20
-
21
-
22
-
23
-
24
-
25
-
26
-
27
-
28
-
29
-
30
-
31
-
32
-
33
-
34
-
35
-
36
-
37
-
38
-
39
-
40
-
41
-
42
-
43
-
44
-
45
-
46
-
47
-
48
-
49
-
50
-
51
-
52
-
53
-
54
-
55
-
56
-
57
-
58
-
59
-
60
-
61
-
62
-
63
-
64
-
65
-
66
-
67
-
68
-
69
-
70
-
71
-
72
-
73
-
74
-
75
-
76
-
77
-
78
-
79
-
80
-
81
-
82
-
83
-
84
-
85
-
86
-
87
-
88
-
89
-
90
-
91
-
92
-
93
-
94
-
95
-
96
-
97
-
98
-
99
-
100
-
101
-
102
-
103
-
104
-
105
-
106
-
107
-
108
-
109
-
110
-
111
-
112
-
113
-
114
-
115
-
116
-
117
-
118
-
119
-
120
-
121
-
122
-
123
-
124
-
125
-
126
-
127
-
128
-
129
-
130
-
131
-
132
-
133
-
134
-
135
-
136
-
137
-
138
-
139
-
140
-
141
-
142
-
143
-
144
-
145
-
146
-
147
-
148
-
149
-
150
-
151
-
152
-
153
-
154
-
155
-
156
-
157
-
158
-
159
-
160
-
161
-
162
-
163
-
164
-
165
-
166
-
167
-
168
-
169
-
170
-
171
-
172
-
173
-
174
-
175
-
176
-
177
-
178
-
179
-
180
-
181
-
182
-
183
-
184
-
185
-
186
-
187
-
188
-
189
-
190
-
191
-
192
-
193
-
194
-
195
-
196
-
197
-
198
-
199
-
200
-
201
-
202
-
203
-
204
-
205
-
206
-
207
-
208
-
209
-
210
-
211
-
 212
212 -
 213
213 -
 214
214 -
 215
215 -
 216
216 -
 217
217 -
 218
218 -
 219
219 -
 220
220 -
 221
221 -
 222
222 -
 223
223 -
 224
224 -
 225
225 -
 226
226 -
 227
227 -
 228
228 -
 229
229 -
 230
230 -
 231
231 -
 232
232 -
233
-
234
-
235
-
236
-
237
-
238
 |
 |
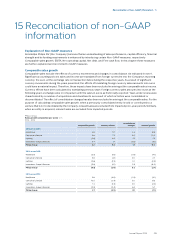
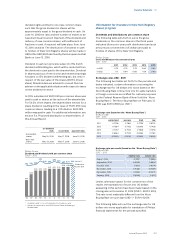
Reconciliation of non-GAAP information 15
222 Annual Report 2015
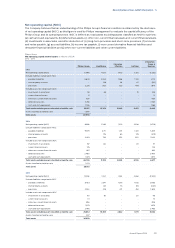
Net debt
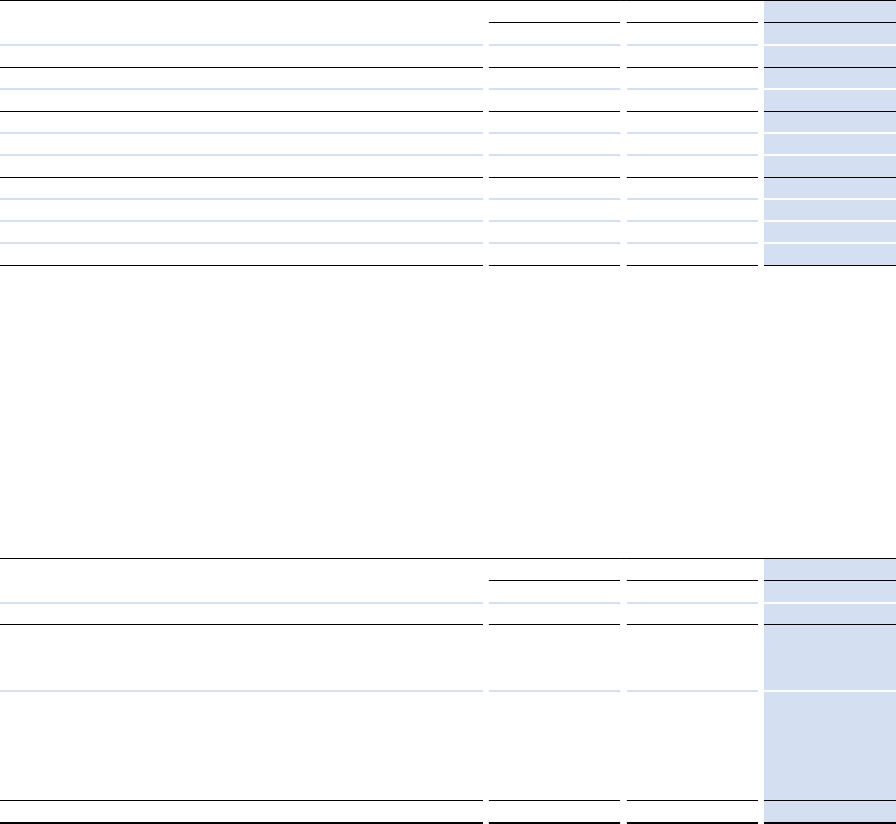
Net debt is dened as the sum of long- and short-term debt minus cash and cash equivalents. The net debt position as
a percentage of the sum of group equity (shareholders’ equity and non-controlling interests) and net debt is presented
to express the nancial strength of the Company. This measure is widely used by management and investment analysts
and is therefore included in the disclosure.
Philips Group
Composition of net debt to group equity in millions of EUR unless otherwise stated
2013 - 2015
2013 2014 2015
Long-term debt 3,309 3,712 4,095
Short-term debt 592 392 1,665
Total debt 3,901 4,104 5,760
Cash and cash equivalents 2,465 1,873 1,766
Net debt1) 1,436 2,231 3,994
Shareholders’ equity 11,214 10,867 11,662
Non-controlling interests 13 101 118
Group equity 11,227 10,968 11,780
Net debt and group equity 12,663 13,199 15,774
Net debt divided by net debt and group equity (in %) 11% 17% 25%
Group equity divided by net debt and group equity (in %) 89% 83% 75%
1) Total debt less cash and cash equivalents.
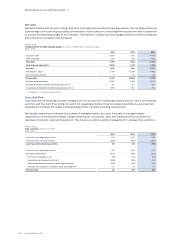
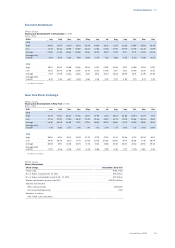
Free cash ow
Cash ows before nancing activities, being the sum of net cash from operating activities and net cash from investing
activities, and free cash ow, being net cash from operating activities minus net capital expenditures, are presented
separately to facilitate the reader’s understanding of the Company’s funding requirements.
Net capital expenditures comprise of purchase of intangible assets, proceeds from sale of intangible assets,
expenditures on development assets, capital expenditures on property, plant and equipment and proceeds from
disposals of property, plant and equipment. This measure is widely used by management to calculate free cash ow.
Philips Group
Free cash ow in millions of EUR
2013 - 2015
2013 2014 2015
Cash ows from operating activities 912 1,303 1,167
Cash ows from investing activities (862) (984) (1,941)
Cash ows before nancing activities 50 319 (774)
Cash ows from operating activities 912 1,303 1,167
Net capital expenditures: (830) (806) (842)
Purchase of intangible assets (49) (114) (121)
Expenditures on development assets (326) (295) (314)
Capital expenditures on property, plant and equipment (482) (437) (522)
Proceeds from disposals of property, plant and equipment 27 40 115
Free cash ow 82 497 325