Philips 2015 Annual Report Download - page 109
Download and view the complete annual report
Please find page 109 of the 2015 Philips annual report below. You can navigate through the pages in the report by either clicking on the pages listed below, or by using the keyword search tool below to find specific information within the annual report.-
 1
1 -
2
-
3
-
4
-
5
-
6
-
7
-
8
-
9
-
10
-
11
-
12
-
13
-
14
-
15
-
16
-
17
-
18
-
19
-
20
-
21
-
22
-
23
-
24
-
25
-
26
-
27
-
28
-
29
-
30
-
31
-
32
-
33
-
34
-
35
-
36
-
37
-
38
-
39
-
40
-
41
-
42
-
43
-
44
-
45
-
46
-
47
-
48
-
49
-
50
-
51
-
52
-
53
-
54
-
55
-
56
-
57
-
58
-
59
-
60
-
61
-
62
-
63
-
64
-
65
-
66
-
67
-
68
-
69
-
70
-
71
-
72
-
73
-
74
-
75
-
76
-
77
-
78
-
79
-
80
-
81
-
82
-
83
-
84
-
85
-
86
-
87
-
88
-
89
-
90
-
91
-
92
-
93
-
94
-
95
-
96
-
97
-
98
-
 99
99 -
 100
100 -
 101
101 -
 102
102 -
 103
103 -
 104
104 -
 105
105 -
 106
106 -
 107
107 -
 108
108 -
 109
109 -
 110
110 -
 111
111 -
 112
112 -
 113
113 -
 114
114 -
 115
115 -
 116
116 -
 117
117 -
 118
118 -
 119
119 -
120
-
121
-
122
-
123
-
124
-
125
-
126
-
127
-
128
-
129
-
130
-
131
-
132
-
133
-
134
-
135
-
136
-
137
-
138
-
139
-
140
-
141
-
142
-
143
-
144
-
145
-
146
-
147
-
148
-
149
-
150
-
151
-
152
-
153
-
154
-
155
-
156
-
157
-
158
-
159
-
160
-
161
-
162
-
163
-
164
-
165
-
166
-
167
-
168
-
169
-
170
-
171
-
172
-
173
-
174
-
175
-
176
-
177
-
178
-
179
-
180
-
181
-
182
-
183
-
184
-
185
-
186
-
187
-
188
-
189
-
190
-
191
-
192
-
193
-
194
-
195
-
196
-
197
-
198
-
199
-
200
-
201
-
202
-
203
-
204
-
205
-
206
-
207
-
208
-
209
-
210
-
211
-
212
-
213
-
214
-
215
-
216
-
217
-
218
-
219
-
220
-
221
-
222
-
223
-
224
-
225
-
226
-
227
-
228
-
229
-
230
-
231
-
232
-
233
-
234
-
235
-
236
-
237
-
238
 |
 |
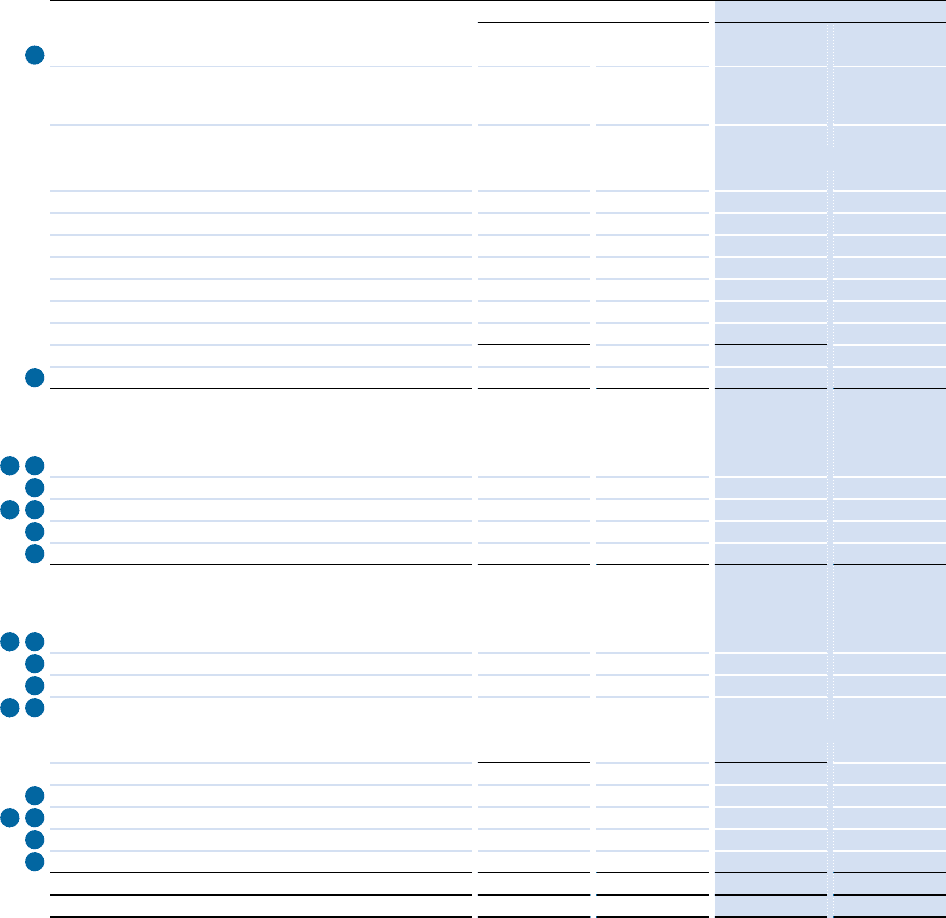
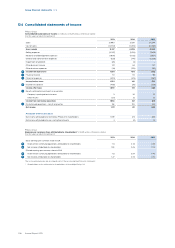
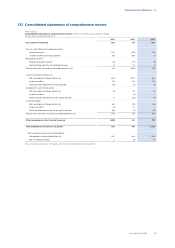
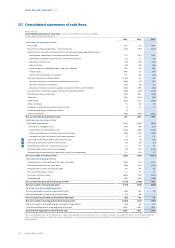
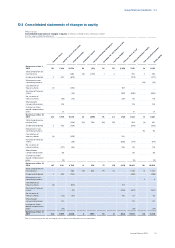
Group nancial statements 12.6
Annual Report 2015 109
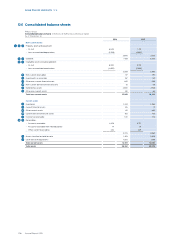
2014 2015
Equity
17 Shareholders’ equity:
Preference shares, par value EUR 0.20 per share:
- Authorized: 2,000,000,000 shares (2014: 2,000,000,000 shares),
issued none
Common shares, par value EUR 0.20 per share:
- Authorized: 2,000,000,000 shares (2014: 2,000,000,000 shares)
- Issued and fully paid: 931,130,387 shares (2014: 934,819,413 shares) 187 186
Capital in excess of par value 2,181 2,669
Retained earnings 8,790 8,040
Revaluation reserve 13 4
Currency translation dierences 229 1,058
Available-for-sale nancial assets 27 56
Cash ow hedges (13) 12
Treasury shares, at cost 14,026,801 shares (2014: 20,430,544 shares) (547) (363)
10,867 11,662
17 Non-controlling interests 101 118
Group equity 10,968 11,780
Non-current liabilities
18 25 Long-term debt 3,712 4,095
30 Non-current derivative nancial liabilities 551 695
19 20 Long-term provisions 2,500 2,392
8Deferred tax liabilities 107 164
22 Other non-current liabilities 1,838 1,782
Total non-current liabilities 8,708 9,128
Current liabilities
18 25 Short-term debt 392 1,665
30 Derivative nancial liabilities 306 238
8Income tax payable 102 116
25 27 Accounts and notes payable:
- Trade creditors 2,495 2,669
- Accounts payable to related parties 4 4
2,499 2,673
21 Accrued liabilities 2,692 2,863
19 20 Short-term provisions 945 833
3Liabilities directly associated with assets held for sale 349 407
22 Other current liabilities 1,391 1,273
Total current liabilities 8,676 10,068
Total liabilities and group equity 28,352 30,976
The accompanying notes are an integral part of these consolidated nancial statements.