Philips 2015 Annual Report Download - page 189
Download and view the complete annual report
Please find page 189 of the 2015 Philips annual report below. You can navigate through the pages in the report by either clicking on the pages listed below, or by using the keyword search tool below to find specific information within the annual report.-
 1
1 -
2
-
3
-
4
-
5
-
6
-
7
-
8
-
9
-
10
-
11
-
12
-
13
-
14
-
15
-
16
-
17
-
18
-
19
-
20
-
21
-
22
-
23
-
24
-
25
-
26
-
27
-
28
-
29
-
30
-
31
-
32
-
33
-
34
-
35
-
36
-
37
-
38
-
39
-
40
-
41
-
42
-
43
-
44
-
45
-
46
-
47
-
48
-
49
-
50
-
51
-
52
-
53
-
54
-
55
-
56
-
57
-
58
-
59
-
60
-
61
-
62
-
63
-
64
-
65
-
66
-
67
-
68
-
69
-
70
-
71
-
72
-
73
-
74
-
75
-
76
-
77
-
78
-
79
-
80
-
81
-
82
-
83
-
84
-
85
-
86
-
87
-
88
-
89
-
90
-
91
-
92
-
93
-
94
-
95
-
96
-
97
-
98
-
99
-
100
-
101
-
102
-
103
-
104
-
105
-
106
-
107
-
108
-
109
-
110
-
111
-
112
-
113
-
114
-
115
-
116
-
117
-
118
-
119
-
120
-
121
-
122
-
123
-
124
-
125
-
126
-
127
-
128
-
129
-
130
-
131
-
132
-
133
-
134
-
135
-
136
-
137
-
138
-
139
-
140
-
141
-
142
-
143
-
144
-
145
-
146
-
147
-
148
-
149
-
150
-
151
-
152
-
153
-
154
-
155
-
156
-
157
-
158
-
159
-
160
-
161
-
162
-
163
-
164
-
165
-
166
-
167
-
168
-
169
-
170
-
171
-
172
-
173
-
174
-
175
-
176
-
177
-
178
-
 179
179 -
 180
180 -
 181
181 -
 182
182 -
 183
183 -
 184
184 -
 185
185 -
 186
186 -
 187
187 -
 188
188 -
 189
189 -
 190
190 -
 191
191 -
 192
192 -
 193
193 -
 194
194 -
 195
195 -
 196
196 -
 197
197 -
 198
198 -
 199
199 -
200
-
201
-
202
-
203
-
204
-
205
-
206
-
207
-
208
-
209
-
210
-
211
-
212
-
213
-
214
-
215
-
216
-
217
-
218
-
219
-
220
-
221
-
222
-
223
-
224
-
225
-
226
-
227
-
228
-
229
-
230
-
231
-
232
-
233
-
234
-
235
-
236
-
237
-
238
 |
 |
Sustainability statements 14
Annual Report 2015 189
Sustainability governance
Sustainability is strongly embedded in our core
business processes, like innovation (EcoDesign),
sourcing (Supplier Sustainability Involvement
Program), manufacturing (Green Manufacturing 2015)
and Logistics (Green Logistics) and projects like the
Circular Economy initiative.
The Sustainability Board is the highest governing
sustainability body in Philips, which was chaired by Jim
Andrew, member of the Executive Committee until
September 2015, as he left the Company. Three other
Executive Committee members sit on the Sustainability
Board jointly with sector and functional executives. The
Sustainability Board convenes four times per year,
denes Philips’ sustainability strategy and programs,
monitors progress and takes corrective action where
needed.
Progress on Sustainability is communicated internally
on a quarterly basis to Philips sta and at least annually
in the Executive Committee and Supervisory Board.
External assurance
KPMG has provided reasonable assurance on whether
the information in chapter 14, Sustainability statements,
of this Annual Report and section 5.2, Social
performance, of this Annual Report and section 5.3,
Environmental performance, of this Annual Report
presents fairly, in all material respects, the sustainability
performance in accordance with the reporting criteria.
Please refer to section 14.4, Independent Auditor’s
Assurance Report, of this Annual Report.
14.1 Economic indicators
This section provides summarized information on
contributions on an accruals basis to the most
important economic stakeholders as a basis to drive
economic growth. For a full understanding of each of
these indicators, see the specic nancial statements
and notes in this report.
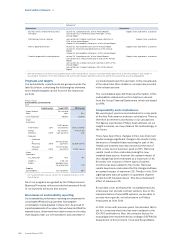
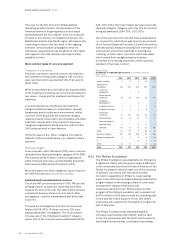
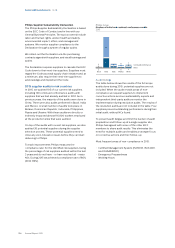
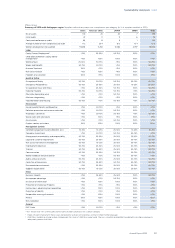
Philips Group
Distribution of direct economic benets in millions of EUR
2013 - 2015
2013 2014 2015
Suppliers: goods and services 12,653 13,185 14,388
Employees: salaries and wages 4,722 5,018 5,533
Shareholders: distribution from
retained earnings 678 729 730
Government: corporate income taxes 466 26 239
Capital providers: net interest 269 251 302
Total purchased goods and services as included in cost
of sales amounted to EUR 14.4 billion, representing 59%
of total revenues of the Philips Group. Of this amount,
approximately 65% was spent with global suppliers, the
remainder with local suppliers.
In 2015, the salaries and wages totaled EUR 5.5 billion.
This amount is some EUR 500 million higher than in
2014, mainly caused by the acquisition of Volcano,
unfavorable currency eects and settlement for
pension de-risking. See note 6, Income from operations
for more information.
Philips’ shareholders were given EUR 730 million in the
form of a dividend, the cash portion of which amounted
to EUR 298 million.
Income taxes amounted to EUR 239 million, compared
to EUR 26 million in 2014. The eective income tax rate
was 38.4%. The increase in 2015 was mainly due to the
non-deductible expenses, new loss carryforwards and
temporary dierences not expected to be realized
which were partly oset by non-taxable income. Non-
taxable income is predominantly attributable to
favorable tax regulations relating to R&D investments.
The comparable eective income tax rate for 2014 was
14.1%.
For a further understanding, see note 8, Income taxes.
For more information, please refer to
Philips’ Tax Principles.
14.2 Social statements
This section provides additional information on (some
of) the social performance parameters reported in
section 5.2, Social performance, of this Annual Report.
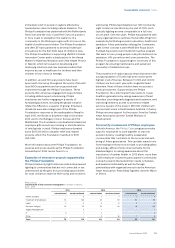
14.2.1 Engaging our employees
In 2014 we implemented a team-focused quarterly
survey called My Accelerate! Survey (MAS).
In 2015, 76% of respondents agreed with the
transformation journey statement: ’In my team we role
model the Philips behaviors’. There was also an
increase in areas concerning ’Speed of decision
making’, resulting in an overall engagement score of
71% favorable answers across the Philips population.
We also noted that, compared with 2014, we
maintained a strong favorable engagement score and
saw a signicant decrease in the unfavorable score
(from 17% down to 7%).
The MAS indicates very high favorable scores within the
set of questions referring to Alignment (‘How clear are
we about customer needs and business priorities?’) and
Execution (‘How good are we at getting things done?’)
at 81% and 74% favorable respectively. An area for
improvement is in the questions referring to Renewal
(‘How do we stay eective and adapt?’). Improvement
initiatives to address these are driven at the team level
via Team Performance Dialogues, and we continue to
monitor our overall engagement results in Leadership
Team quarterly reviews.