Philips 2015 Annual Report Download - page 35
Download and view the complete annual report
Please find page 35 of the 2015 Philips annual report below. You can navigate through the pages in the report by either clicking on the pages listed below, or by using the keyword search tool below to find specific information within the annual report.-
 1
1 -
2
-
3
-
4
-
5
-
6
-
7
-
8
-
9
-
10
-
11
-
12
-
13
-
14
-
15
-
16
-
17
-
18
-
19
-
20
-
21
-
22
-
23
-
24
-
 25
25 -
 26
26 -
 27
27 -
 28
28 -
 29
29 -
 30
30 -
 31
31 -
 32
32 -
 33
33 -
 34
34 -
 35
35 -
 36
36 -
 37
37 -
 38
38 -
 39
39 -
 40
40 -
 41
41 -
 42
42 -
 43
43 -
 44
44 -
 45
45 -
46
-
47
-
48
-
49
-
50
-
51
-
52
-
53
-
54
-
55
-
56
-
57
-
58
-
59
-
60
-
61
-
62
-
63
-
64
-
65
-
66
-
67
-
68
-
69
-
70
-
71
-
72
-
73
-
74
-
75
-
76
-
77
-
78
-
79
-
80
-
81
-
82
-
83
-
84
-
85
-
86
-
87
-
88
-
89
-
90
-
91
-
92
-
93
-
94
-
95
-
96
-
97
-
98
-
99
-
100
-
101
-
102
-
103
-
104
-
105
-
106
-
107
-
108
-
109
-
110
-
111
-
112
-
113
-
114
-
115
-
116
-
117
-
118
-
119
-
120
-
121
-
122
-
123
-
124
-
125
-
126
-
127
-
128
-
129
-
130
-
131
-
132
-
133
-
134
-
135
-
136
-
137
-
138
-
139
-
140
-
141
-
142
-
143
-
144
-
145
-
146
-
147
-
148
-
149
-
150
-
151
-
152
-
153
-
154
-
155
-
156
-
157
-
158
-
159
-
160
-
161
-
162
-
163
-
164
-
165
-
166
-
167
-
168
-
169
-
170
-
171
-
172
-
173
-
174
-
175
-
176
-
177
-
178
-
179
-
180
-
181
-
182
-
183
-
184
-
185
-
186
-
187
-
188
-
189
-
190
-
191
-
192
-
193
-
194
-
195
-
196
-
197
-
198
-
199
-
200
-
201
-
202
-
203
-
204
-
205
-
206
-
207
-
208
-
209
-
210
-
211
-
212
-
213
-
214
-
215
-
216
-
217
-
218
-
219
-
220
-
221
-
222
-
223
-
224
-
225
-
226
-
227
-
228
-
229
-
230
-
231
-
232
-
233
-
234
-
235
-
236
-
237
-
238
 |
 |
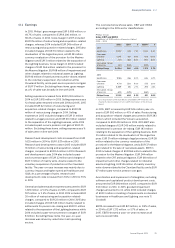
Group performance 5.2.1
Annual Report 2015 35
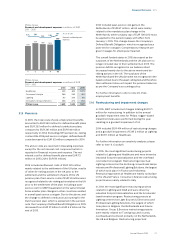
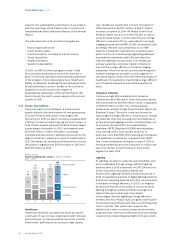
well-being products that help people live a healthy life
improved the lives of 304 million, and our Green
Products that contribute to a healthy ecosystem 1.7
billion people. After the elimination of double counts –
people touched multiple times – we arrived at 2.0
billion lives. This is an increase of around 140 million
compared to 2014, mainly driven by Healthcare in
Greater China and North America, Consumer Lifestyle
in Greater China, ASEAN and North America, and
Lighting in North America and the Indian subcontinent.
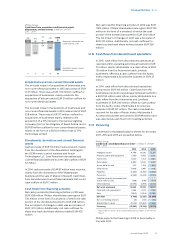
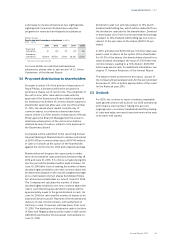
Philips Group
Lives improved in billions
0.3
by Philips
well-being
products
0.88
by Philips
care products
1.7
by Philips
Green Products
Total: 2.0 billion (double counts eliminated)
Double counts
Conceptual drawing, areas do not reect actual proportions
More information on this metric can be found in
Methodology for calculating Lives Improved.
5.2.2 Employee engagement
Employee engagement is key to our competitive
performance and at the heart of our vision, promoting
the best place to work for people who share our
passion. Engaged employees are emotionally
committed to and proud of our company, they help us
meet our business goals, and they contribute to making
our workplace the best it can be. We can only truly oer
an environment in which all our people can thrive when
we maintain a dialogue with our people to understand
their needs. Our employees take the time for this
dialogue, directly shaping the work environment and
our inclusive culture. As a result, high engagement
levels not only help Philips to grow, but also help us to
understand our employees’ needs in depth and
respond to these in turn.
Given that employee feedback and input is so critical,
we actively track it via quarterly surveys with a set of
targeted questions. In 2014, we implemented a
complementary, team-focused survey called My
Accelerate! Survey (MAS) with accompanying
promotion of Team Performance Dialogues with
People Managers and their teams. This proved to be a
positive driver of employee action to increase team
eectiveness, and, as a result, we ran MAS in each
quarter of 2015 as our way of monitoring engagement.
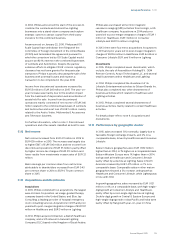
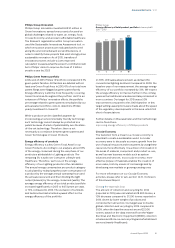
In 2015, MAS had an average employee response rate
of 50% across all four quarters, and we recorded an
overall engagement score of 71% favorable across the
Philips population. This was in line with 2014 results,
and we were pleased to see a signicant downward
trend in the unfavorable score (decreasing from 17% in
2014 to 7% in 2015).
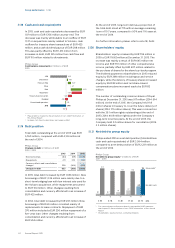
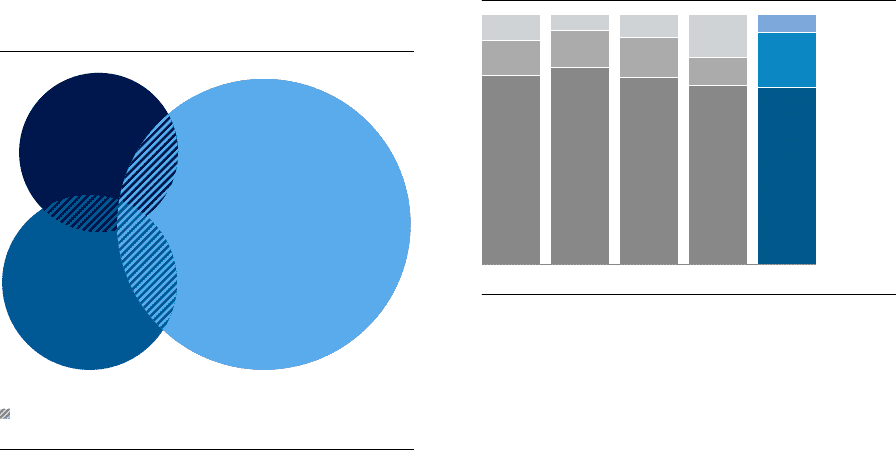
Philips Group
Employee Engagement Index in %
2011 - 2015
76
14
10
‘11
79
15
6
‘121)
75
16
9
‘13
72
11
17
‘142)
71 Favorable
22 Neutral
7Unfavorable
‘152)
1) Based on 60 pulse surveys conducted in 2012
2) Based on My Accelerate! Surveys
For more information on MAS, please refer to sub-
section 14.2.1, Engaging our employees, of this Annual
Report.
5.2.3 Inclusion
At Philips, we believe that the best place to work is an
inclusive place to work. This means celebrating and
fostering a work environment in which all of our
people’s ideas, knowledge, perspectives, experiences
and styles are valued. It also means that all individuals
are treated fairly and respectfully, have equal access to
opportunities and resources, and can contribute fully to
Philips’ success. In this report we publish data on
international, gender and age diversity, as proxies for
the wider inclusion we promote.
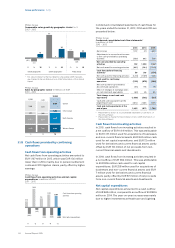
Philips is a global company, and our executives
originate from more than 35 countries. We embrace a
global mindset and actively promote and build
capability in this area. The composition of our Executive
Committee and Supervisory Board likewise reects our
global focus.
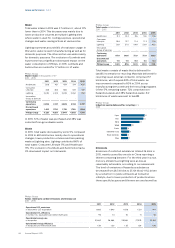
In terms of gender diversity, we recorded an increase in
the share of female executives to 19% at year-end 2015
– up from 18% in 2014. We are well on track to achieve
our aspiration of 20% female executives by year-end
2016. This is driven both by our active engagement of
senior female leaders globally, and also by the fact that
our inclusion culture is embedded in our people
practices, policies and processes. Overall, 35% of
Philips employees in 2015 were female. Philips has 7
persons in the Executive Committee (1 female) and 9 in
the Supervisory Board (3 females), which means that 4
out of 16 positions (or 25%) are held by women.