Philips 2015 Annual Report Download - page 5
Download and view the complete annual report
Please find page 5 of the 2015 Philips annual report below. You can navigate through the pages in the report by either clicking on the pages listed below, or by using the keyword search tool below to find specific information within the annual report.-
 1
1 -
 2
2 -
 3
3 -
 4
4 -
 5
5 -
 6
6 -
 7
7 -
 8
8 -
 9
9 -
 10
10 -
 11
11 -
 12
12 -
 13
13 -
 14
14 -
 15
15 -
 16
16 -
17
-
18
-
19
-
20
-
21
-
22
-
23
-
24
-
25
-
26
-
27
-
28
-
29
-
30
-
31
-
32
-
33
-
34
-
35
-
36
-
37
-
38
-
39
-
40
-
41
-
42
-
43
-
44
-
45
-
46
-
47
-
48
-
49
-
50
-
51
-
52
-
53
-
54
-
55
-
56
-
57
-
58
-
59
-
60
-
61
-
62
-
63
-
64
-
65
-
66
-
67
-
68
-
69
-
70
-
71
-
72
-
73
-
74
-
75
-
76
-
77
-
78
-
79
-
80
-
81
-
82
-
83
-
84
-
85
-
86
-
87
-
88
-
89
-
90
-
91
-
92
-
93
-
94
-
95
-
96
-
97
-
98
-
99
-
100
-
101
-
102
-
103
-
104
-
105
-
106
-
107
-
108
-
109
-
110
-
111
-
112
-
113
-
114
-
115
-
116
-
117
-
118
-
119
-
120
-
121
-
122
-
123
-
124
-
125
-
126
-
127
-
128
-
129
-
130
-
131
-
132
-
133
-
134
-
135
-
136
-
137
-
138
-
139
-
140
-
141
-
142
-
143
-
144
-
145
-
146
-
147
-
148
-
149
-
150
-
151
-
152
-
153
-
154
-
155
-
156
-
157
-
158
-
159
-
160
-
161
-
162
-
163
-
164
-
165
-
166
-
167
-
168
-
169
-
170
-
171
-
172
-
173
-
174
-
175
-
176
-
177
-
178
-
179
-
180
-
181
-
182
-
183
-
184
-
185
-
186
-
187
-
188
-
189
-
190
-
191
-
192
-
193
-
194
-
195
-
196
-
197
-
198
-
199
-
200
-
201
-
202
-
203
-
204
-
205
-
206
-
207
-
208
-
209
-
210
-
211
-
212
-
213
-
214
-
215
-
216
-
217
-
218
-
219
-
220
-
221
-
222
-
223
-
224
-
225
-
226
-
227
-
228
-
229
-
230
-
231
-
232
-
233
-
234
-
235
-
236
-
237
-
238
 |
 |
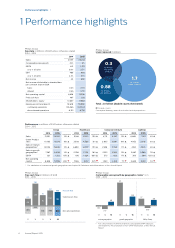
Performance highlights 1
Annual Report 2015 5
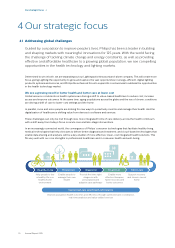
Philips Group
EBIT and EBITA1) in millions of EUR
2011 - 2015
1,876
(542)
1,334
‘11
411
592
1,003
‘12
421
1,855
2,276
‘13
335
486
821
‘14
380 Amortization and impairment
in value
992 EBIT in value
1,372 EBITA in value
‘15
6.7% 4.5%
10.4%
3.8% 5.7% EBITA as a % of sales
1) For a reconciliation to the most directly comparable GAAP measures,
see chapter 15, Reconciliation of non-GAAP information, of this Annual
Report
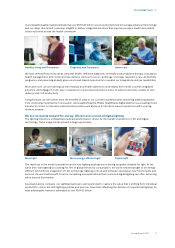
Philips Group
Green Product sales per sector in millions of EUR
2011 - 2015
2,663
1,101
3,955
7,719
‘11
3,610
1,619
5,056
10,285
‘12
3,690
2,270
5,037
10,997
‘13
3,508
2,605
4,952
11,065
‘14
4,580 Healthcare
3,091 Consumer Lifestyle
5,343 Lighting
13,014
‘15
38.8%
46.3% 50.0% 51.7% 53.7% As a % of sales
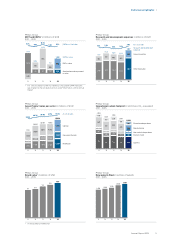
Philips Group
Brand value1) in billions of USD
2011 - 2015
8.7
‘11
9.0
‘12
9.8
‘13
10.3
‘14
10.9
‘15
1) As measured by Interbrand
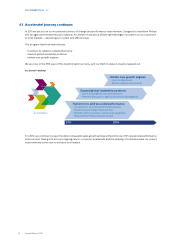
Philips Group
Research and development expenses in millions of EUR
2011 - 2015
1,180
363
1,543
‘11
1,271
453
1,724
‘12
1,254
405
1,659
‘13
1,172
463
1,635
‘14
1,432 Other Innovation
495 Green Innovation
1,927 Research and development
expenses
‘15
7.7% 7.8%
7.5% 7.6%
7.9% As a % of sales
Philips Group
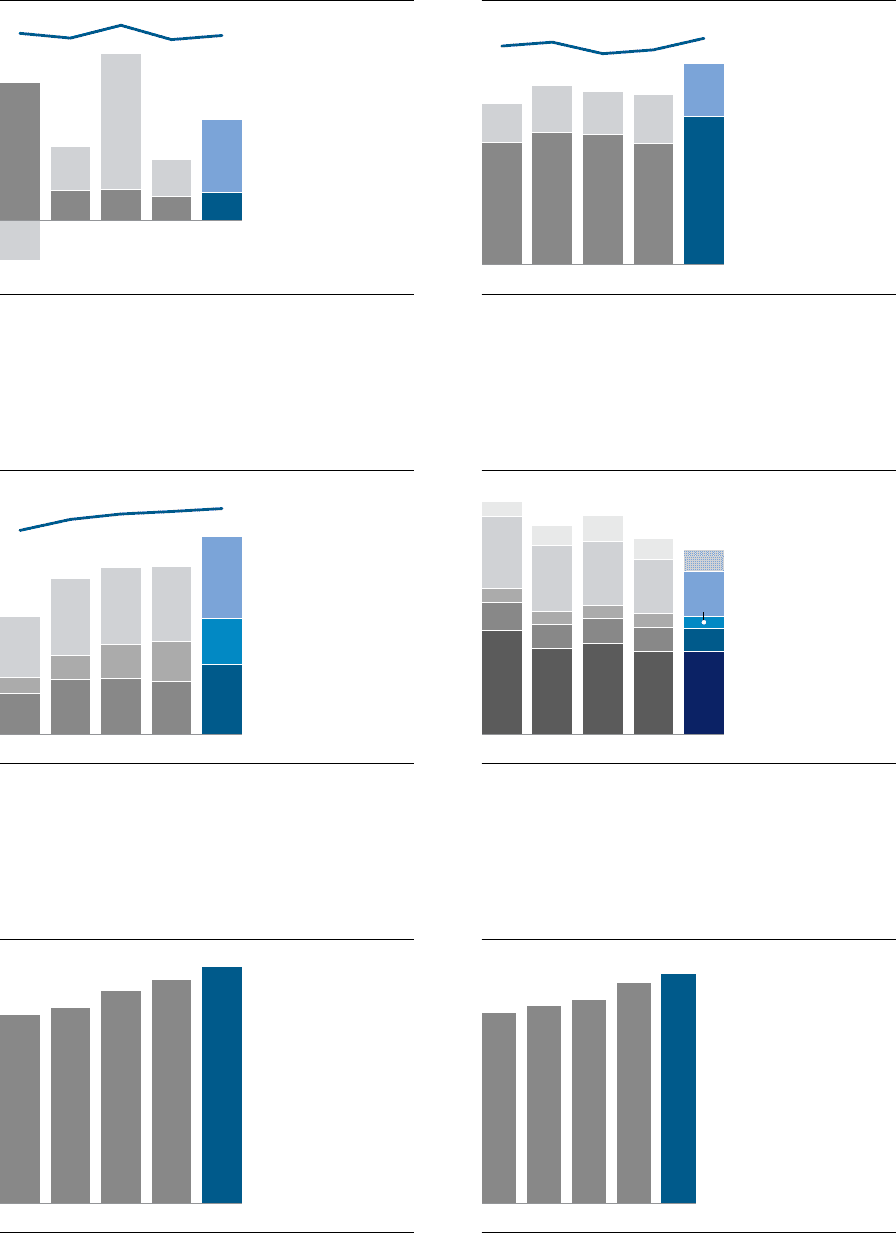
Operational carbon footprint in kilotonnes CO2-equivalent
2011 - 2015
903
243
119
627
130
2,022
‘11
745
205
117
573
167
1,807
‘12
786
218
116
558
220
1,898
‘13
720
204
122
475
176
1,697
‘14
718 Logistics
202 Business travel
103
Non-industrial operations
394 Manufacturing
183 Discontinued operations
1,600
‘15
Philips Group
New patents led in number of patents
2011 - 2015
1,450
‘11
1,500
‘12
1,550
‘13
1,680
‘14
1,750
‘15