Philips 2015 Annual Report Download - page 32
Download and view the complete annual report
Please find page 32 of the 2015 Philips annual report below. You can navigate through the pages in the report by either clicking on the pages listed below, or by using the keyword search tool below to find specific information within the annual report.-
 1
1 -
2
-
3
-
4
-
5
-
6
-
7
-
8
-
9
-
10
-
11
-
12
-
13
-
14
-
15
-
16
-
17
-
18
-
19
-
20
-
21
-
 22
22 -
 23
23 -
 24
24 -
 25
25 -
 26
26 -
 27
27 -
 28
28 -
 29
29 -
 30
30 -
 31
31 -
 32
32 -
 33
33 -
 34
34 -
 35
35 -
 36
36 -
 37
37 -
 38
38 -
 39
39 -
 40
40 -
 41
41 -
 42
42 -
43
-
44
-
45
-
46
-
47
-
48
-
49
-
50
-
51
-
52
-
53
-
54
-
55
-
56
-
57
-
58
-
59
-
60
-
61
-
62
-
63
-
64
-
65
-
66
-
67
-
68
-
69
-
70
-
71
-
72
-
73
-
74
-
75
-
76
-
77
-
78
-
79
-
80
-
81
-
82
-
83
-
84
-
85
-
86
-
87
-
88
-
89
-
90
-
91
-
92
-
93
-
94
-
95
-
96
-
97
-
98
-
99
-
100
-
101
-
102
-
103
-
104
-
105
-
106
-
107
-
108
-
109
-
110
-
111
-
112
-
113
-
114
-
115
-
116
-
117
-
118
-
119
-
120
-
121
-
122
-
123
-
124
-
125
-
126
-
127
-
128
-
129
-
130
-
131
-
132
-
133
-
134
-
135
-
136
-
137
-
138
-
139
-
140
-
141
-
142
-
143
-
144
-
145
-
146
-
147
-
148
-
149
-
150
-
151
-
152
-
153
-
154
-
155
-
156
-
157
-
158
-
159
-
160
-
161
-
162
-
163
-
164
-
165
-
166
-
167
-
168
-
169
-
170
-
171
-
172
-
173
-
174
-
175
-
176
-
177
-
178
-
179
-
180
-
181
-
182
-
183
-
184
-
185
-
186
-
187
-
188
-
189
-
190
-
191
-
192
-
193
-
194
-
195
-
196
-
197
-
198
-
199
-
200
-
201
-
202
-
203
-
204
-
205
-
206
-
207
-
208
-
209
-
210
-
211
-
212
-
213
-
214
-
215
-
216
-
217
-
218
-
219
-
220
-
221
-
222
-
223
-
224
-
225
-
226
-
227
-
228
-
229
-
230
-
231
-
232
-
233
-
234
-
235
-
236
-
237
-
238
 |
 |
Group performance 5.1.18
32 Annual Report 2015
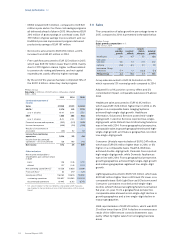
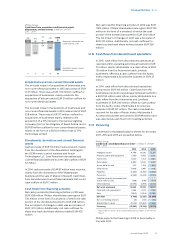
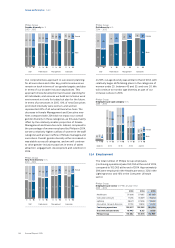
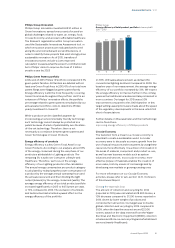
5.1.18 Cash and cash equivalents
In 2015, cash and cash equivalents decreased by EUR
107 million to EUR 1,766 million at year-end. The
decrease was mainly attributable to an outow of EUR
1,137 on acquisitions mainly related to Volcano, cash
outows for treasury share transactions of EUR 425
million, and a cash dividend payout of EUR 298 million.
This was partly oset by EUR 1,231 million from
increases in debt, EUR 325 million free cash ow and
EUR 110 million related to divestments.
Philips Group
Cash balance movements in millions of EUR
2015
1,8732014
+110Divestments
+3251)
Free cash flow
+82)
Other
+1,231Debt
-1,137Acquisitions
-425Treasury share transaction
-298Dividend
+79Discontinued operations
1,7662015
-107
1) Please refer to chapter 15, Reconciliation of non-GAAP information, of
this Annual Report
2) Includes cash ow for derivatives and currency eect
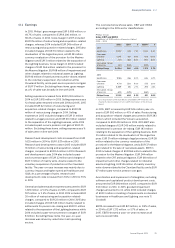
5.1.19 Debt position
Total debt outstanding at the end of 2015 was EUR
5,760 million, compared with EUR 4,104 million at
the end of 2014.
Philips Group
Changes in debt in millions of EUR
2013 - 2015
2013 2014 2015
New borrowings (64) (69) (1,335)
Repayments 471 370 104
Currency eects and consolidation
changes 226 (504) (425)
Changes in debt 633 (203) (1,656)
In 2015, total debt increased by EUR 1,656 million. New
borrowings of EUR 1,335 million were mainly due to a
short-term bridging loan with low interest rate used for
the Volcano acquisition, while repayments amounted
to EUR 104 million. Other changes resulting from
consolidation and currency eects led to an increase of
EUR 425 million.
In 2014, total debt increased by EUR 203 million. New
borrowings of EUR 69 million consisted mainly of
replacements to lease contracts. Repayment of EUR
370 million included a EUR 250 million repayment of a
ve-year loan. Other changes resulting from
consolidation and currency eects led to an increase of
EUR 504 million.
At the end of 2015, long-term debt as a proportion of
the total debt stood at 71% with an average remaining
term of 10.7 years, compared to 90% and 11.6 years at
the end of 2014.
For further information, please refer to note 18, Debt.
5.1.20 Shareholders’ equity
Shareholders’ equity increased by EUR 795 million in
2015 to EUR 11,662 million at December 31, 2015. The
increase was mainly a result of EUR 645 million net
income and EUR 791 million of other comprehensive
income, partially oset by EUR 507 million related to
the purchase of shares for the share buy-back program.
The dividend payment to shareholders in 2015 reduced
equity by EUR 298 million including tax and service
charges, while the delivery of treasury shares increased
equity by EUR 82 million and net share-based
compensation plans increased equity by EUR 82
million.
The number of outstanding common shares of Royal
Philips at December 31, 2015 was 917 million (2014: 914
million). At the end of 2015, the Company held 11.8
million shares in treasury to cover the future delivery of
shares (2014: 17.1 million shares). This was in connection
with the 39.1 million rights outstanding at the end of
2015 (2014: 40.8 million rights) under the Company’s
long-term incentive plans. At the end of 2015, the
Company held 2.2 million shares for cancellation (2014:
3.3 million shares).
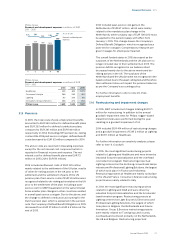
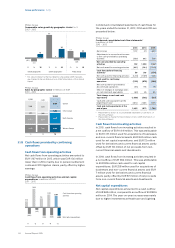
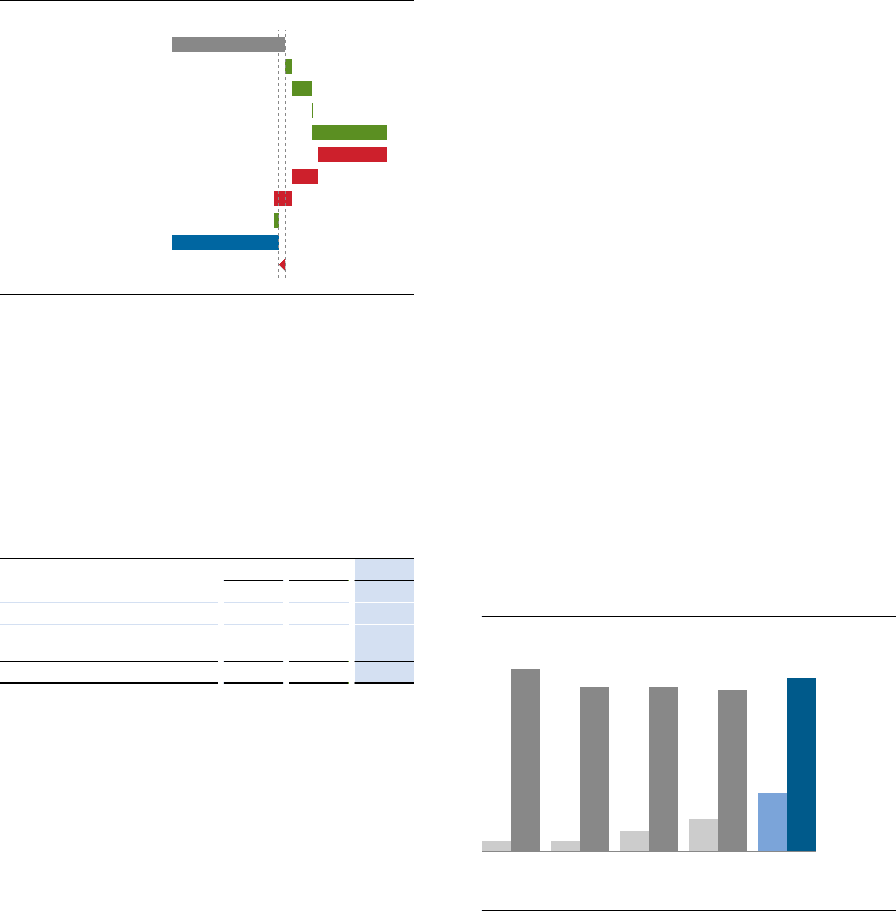
5.1.21 Net debt to group equity
Philips ended 2015 in a net debt position (total debt less
cash and cash equivalents) of EUR 3,994 million,
compared to a net debt position of EUR 2,231 million at
the end of 2014.
Philips Group
Net debt to group equity1) in billions of EUR
2011 - 2015
0.7
12.4
‘11
5 : 95
0.7
11.2
‘12
6 : 94
1.4
11.2
‘13
11 : 89
2.2
11.0
‘14
17 : 83
4.0 Net debt (cash)
11.8 Group equity2)
‘15
25 : 75 ratio
1) For a reconciliation to the most directly comparable GAAP measures,
see chapter 15, Reconciliation of non-GAAP information, of this Annual
Report
2) Shareholders’ equity and non-controlling interests