Philips 2015 Annual Report Download - page 31
Download and view the complete annual report
Please find page 31 of the 2015 Philips annual report below. You can navigate through the pages in the report by either clicking on the pages listed below, or by using the keyword search tool below to find specific information within the annual report.-
 1
1 -
2
-
3
-
4
-
5
-
6
-
7
-
8
-
9
-
10
-
11
-
12
-
13
-
14
-
15
-
16
-
17
-
18
-
19
-
20
-
 21
21 -
 22
22 -
 23
23 -
 24
24 -
 25
25 -
 26
26 -
 27
27 -
 28
28 -
 29
29 -
 30
30 -
 31
31 -
 32
32 -
 33
33 -
 34
34 -
 35
35 -
 36
36 -
 37
37 -
 38
38 -
 39
39 -
 40
40 -
 41
41 -
42
-
43
-
44
-
45
-
46
-
47
-
48
-
49
-
50
-
51
-
52
-
53
-
54
-
55
-
56
-
57
-
58
-
59
-
60
-
61
-
62
-
63
-
64
-
65
-
66
-
67
-
68
-
69
-
70
-
71
-
72
-
73
-
74
-
75
-
76
-
77
-
78
-
79
-
80
-
81
-
82
-
83
-
84
-
85
-
86
-
87
-
88
-
89
-
90
-
91
-
92
-
93
-
94
-
95
-
96
-
97
-
98
-
99
-
100
-
101
-
102
-
103
-
104
-
105
-
106
-
107
-
108
-
109
-
110
-
111
-
112
-
113
-
114
-
115
-
116
-
117
-
118
-
119
-
120
-
121
-
122
-
123
-
124
-
125
-
126
-
127
-
128
-
129
-
130
-
131
-
132
-
133
-
134
-
135
-
136
-
137
-
138
-
139
-
140
-
141
-
142
-
143
-
144
-
145
-
146
-
147
-
148
-
149
-
150
-
151
-
152
-
153
-
154
-
155
-
156
-
157
-
158
-
159
-
160
-
161
-
162
-
163
-
164
-
165
-
166
-
167
-
168
-
169
-
170
-
171
-
172
-
173
-
174
-
175
-
176
-
177
-
178
-
179
-
180
-
181
-
182
-
183
-
184
-
185
-
186
-
187
-
188
-
189
-
190
-
191
-
192
-
193
-
194
-
195
-
196
-
197
-
198
-
199
-
200
-
201
-
202
-
203
-
204
-
205
-
206
-
207
-
208
-
209
-
210
-
211
-
212
-
213
-
214
-
215
-
216
-
217
-
218
-
219
-
220
-
221
-
222
-
223
-
224
-
225
-
226
-
227
-
228
-
229
-
230
-
231
-
232
-
233
-
234
-
235
-
236
-
237
-
238
 |
 |
Group performance 5.1.16
Annual Report 2015 31
Philips Group
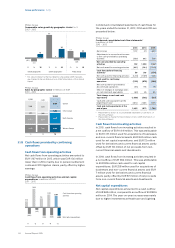
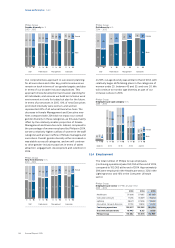
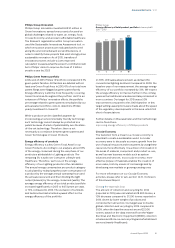
Cash ows from acquisitions and nancial assets,
divestments and derivatives in millions of EUR
2011 - 2015
132
(550)
(418)
‘11
(43)
(428)
(471)
‘12
(8)
(24)
(32)
‘13
80
(258)
(178)
‘14
38 Divestments, derivatives and
current financial assets
(1,137) Acquisitions and non-current
financial assets
(1,099)
‘15
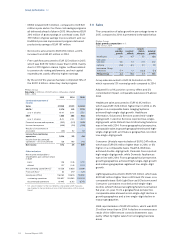
Acquisitions and non-current nancial assets
The net cash impact of acquisitions of businesses and
non-current nancial assets in 2015 was a total of EUR
1,137 million. There was a EUR 1,116 million outow for
acquisitions of businesses, mainly related to the
acquisition of Volcano and a EUR 21 million outow for
non-current nancial assets.
The net cash impact of acquisitions of businesses and
non-current nancial assets in 2014, was a total of EUR
258 million. There was a EUR 177 million outow for
acquisitions of businesses mainly related to the
acquisition of a 51% interest in the General Lighting
Company (GLC) in the Kingdom of Saudi Arabia, and a
EUR 81 million outow for non-current nancial assets,
mainly in the form of a EUR 60 million loan to TPV
Technology Limited.
Divestments, derivatives and current nancial
assets
Cash proceeds of EUR 110 million were received, mainly
from the divestment of the Assembléon Holding B.V.,
the OEM remote control business and Axsun
Technologies LLC. Cash ows from derivatives and
current nancial assets led to a net cash outow of EUR
72 million.
In 2014, cash proceeds of EUR 87 million were received,
mainly from the divestment of the Shakespeare
business and the sale of shares in Neusoft. Cash ows
from derivatives and current nancial assets led to a net
cash outow of EUR 7 million.
Cash ows from nancing activities
Net cash provided by nancing activities in 2015 was
EUR 508 million. Philips’ shareholders were given EUR
730 million in the form of a dividend, of which the cash
portion of the dividend amounted to EUR 298 million.
The net impact of changes in debt was an increase of
EUR 1,231 million. Additionally, net cash outows for
share buy-back and share delivery totaled EUR 425
million.
Net cash used for nancing activities in 2014 was EUR
1,189 million. Philips’ shareholders were given EUR 729
million in the form of a dividend, of which the cash
portion of the dividend amounted to EUR 292 million.
The net impact of changes in debt was a decrease of
EUR 301 million. Additionally, net cash outows for
share buy-back and share delivery totaled EUR 596
million.
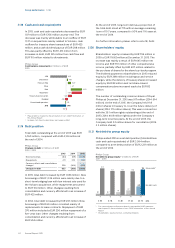
5.1.16 Cash ows from discontinued operations
In 2015, cash inow from discontinued operations as
reported within operating activities amounted to EUR
79 million, mainly attributable to a cash inow of EUR
115 million from the Automotive and Lumileds
businesses, oset by a cash outow from the Audio,
Video, Multimedia & Accessories business of EUR 37
million.
In 2014, cash inow from discontinued operations
amounted to EUR 193 million. Cash ows from the
businesses reported in operating activities amounted to
a EUR 105 million cash inow, mainly attributable to a
cash inow from the Automotive and Lumileds
businesses of EUR 240 million, oset by cash outow
from the Audio, Video, Multimedia & Accessories
business of EUR 107 million. The cash consideration
received for the sale of Audio, Video, Multimedia &
Accessories business amounted to EUR 88 million and
was reported as cash ow from investing activities.
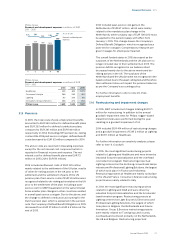
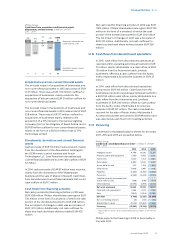
5.1.17 Financing
Condensed consolidated balance sheets for the years
2013, 2014 and 2015 are presented below:
Philips Group
Condensed consolidated balance sheet1) in millions of EUR
2013 - 2015
2013 2014 2015
Intangible assets 9,766 10,526 12,216
Property, plant and equipment 2,780 2,095 2,322
Inventories 3,240 3,314 3,463
Receivables 4,892 5,040 5,287
Assets held for sale 507 1,613 1,809
Other assets 2,909 3,891 4,113
Payables (5,435) (5,293) (5,652)
Provisions (2,554) (3,445) (3,225)
Liabilities directly associated with
assets held for sale (348) (349) (407)
Other liabilities (3,094) (4,193) (4,152)
Net asset employed 12,663 13,199 15,774
Cash and cash equivalents 2,465 1,873 1,766
Debt (3,901) (4,104) (5,760)
Net debt (1,436) (2,231) (3,994)
Non-controlling interests (13) (101) (118)
Shareholders’ equity (11,214) (10,867) (11,662)
Financing (12,663) (13,199) (15,774)
1) Please refer to section 12.6, Consolidated balance sheets, of this Annual
Report
Philips expects the nancing in 2016 to be broadly in
line with 2015.